Little late to the party, but working on getting a node fired up, .
I am blanking out here (forgot what I did last testnet), but for those who are starting up safenode manually with args + compiling it from source with other features, what is at least 1 PEER_ID that should be set an env. var or passed into safenode pid?
I didn’t see one mentioned in the OP.
Is there a static URL that contains the network PEER IDs published by MaidSafe’s nodes that can be used to bootstrap the node? i.e. location of the network_contacts file? (if that still exists)?
Most likely, latency increased because of increase in network usage and not because of RAM.
But RAM and network usage may increase because of some common event, yeah.
Pings are processed at some low level in operating systems (kernel or so) and such processing not requires much RAM.
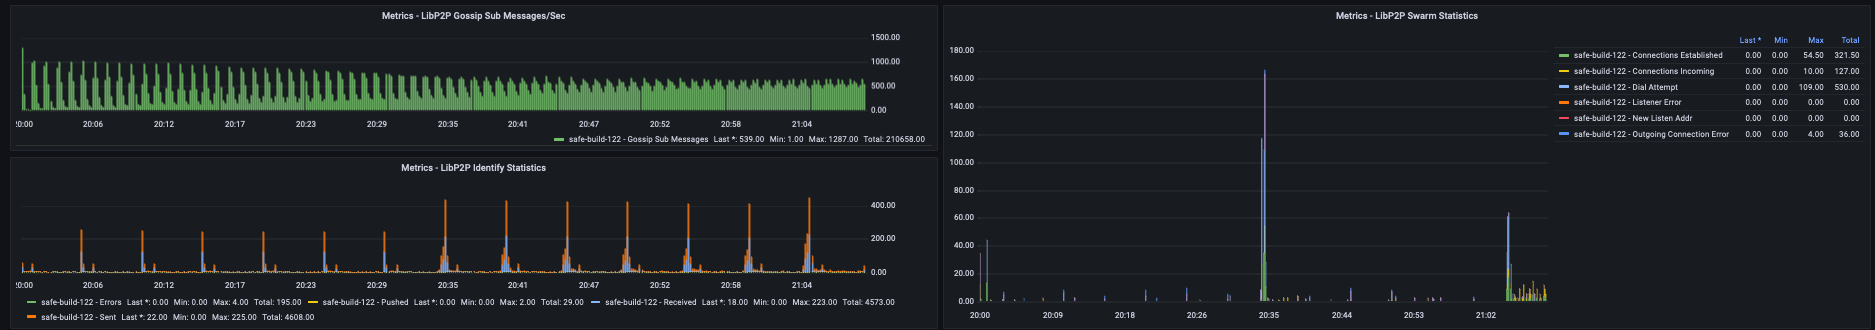
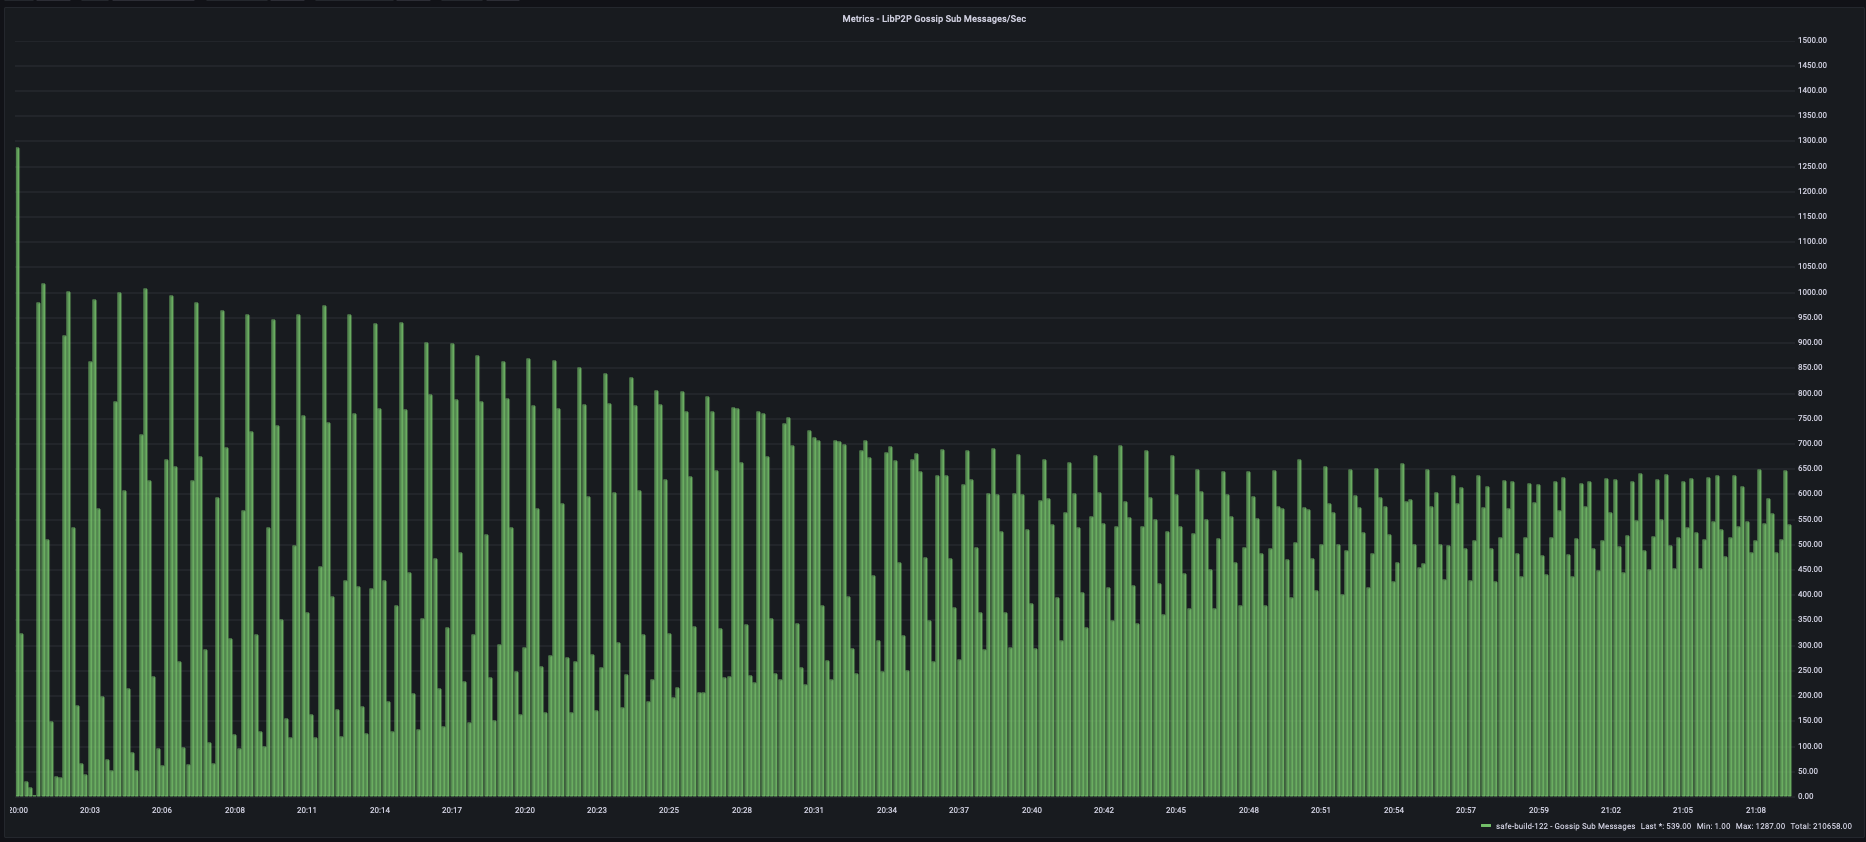
Transfer rate of Gossip Sub Messages from metrics endpoint being received.
Fixed network traffic rate (correct units) on the derivative function
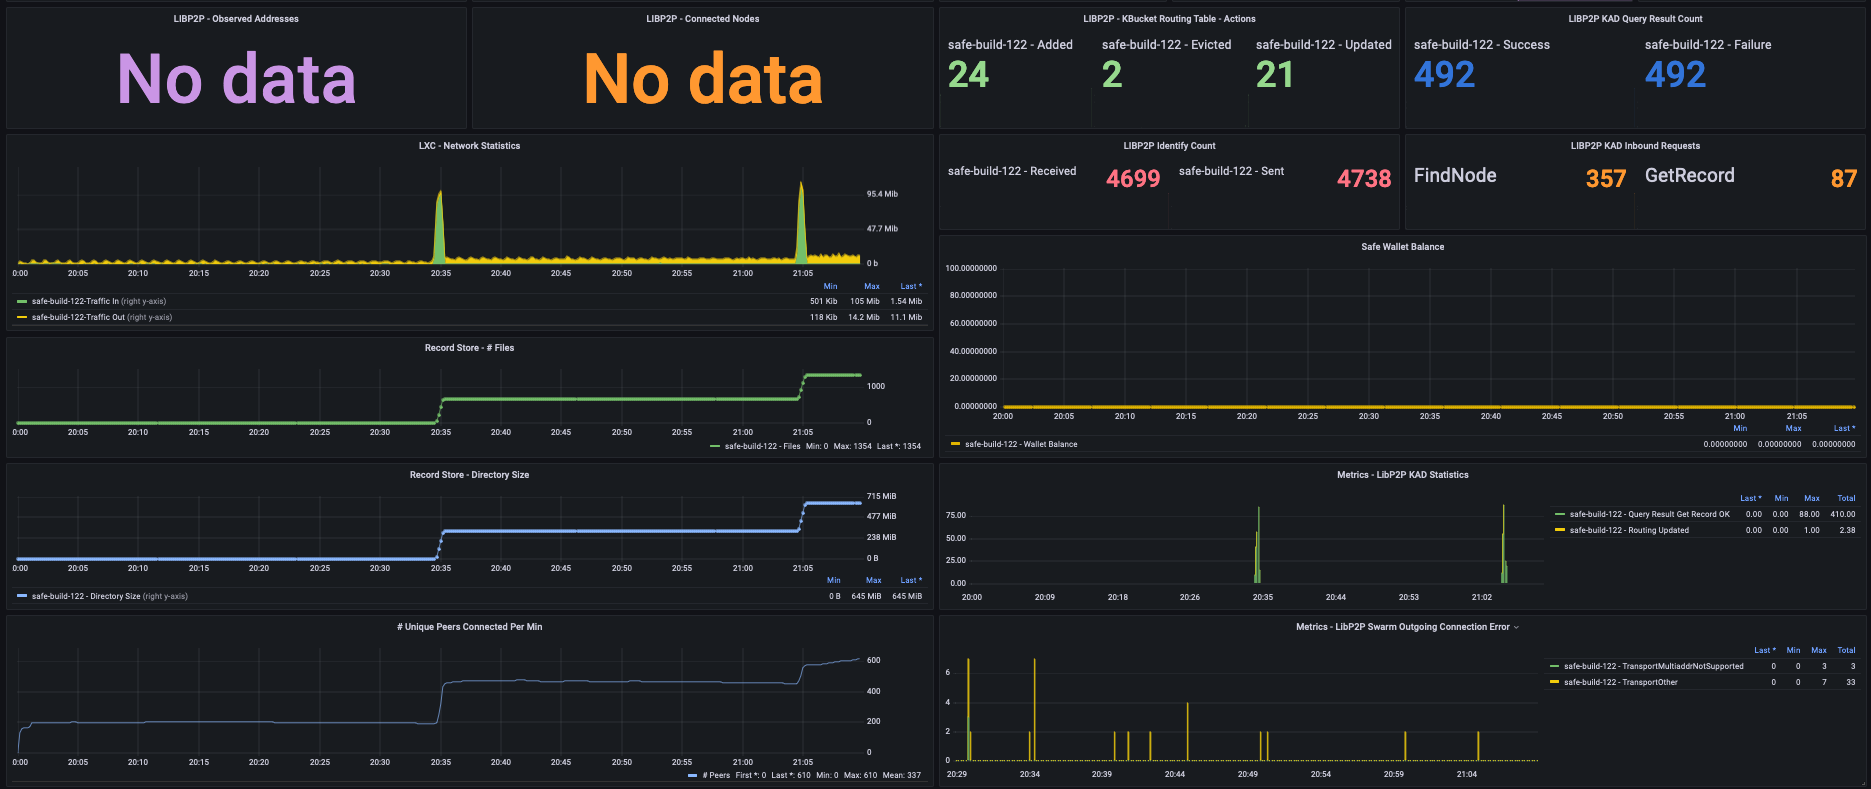
Note: The areas where this is ‘No Data’ particularly under ‘PUT Request’, ‘Chunk Written’, and ‘Chunk Deleted’, is likely due to logs being changed on disk, and I would need to circle back and re-update the parser logic on my end (TBD). In addition, the ‘Unique Peer IDs’, ‘Unique Request IDs’, and ‘Unique Chunk Addresses’ also broke from my parser logic back-end, due to the log format changing (TBD).
However, the ‘PUT Records OK’, ‘SN Networking Records Stored’, ‘SN Replication Triggered’ etc are all coming from metrics endpoint.
Few Observations:
Every-time there is a large burst of chunk being stored, the # of peers connected remain higher than previous baseline, and do not seem to decrease.
In the case above, the network traffic also nearly doubles / (linear scaling?), and remains at the higher levels due to likely more peers being actively connected to the node.
The LibP2P identify sent and received periodically also increase (new maximum) once more chunks are stored, including a rise in their average baseline.
Gossip Sub Messages received in this case seem to remain steady and flat (reducing in overall maximum), but the base minimum seems to be increasing (the rate) from starting initial point.
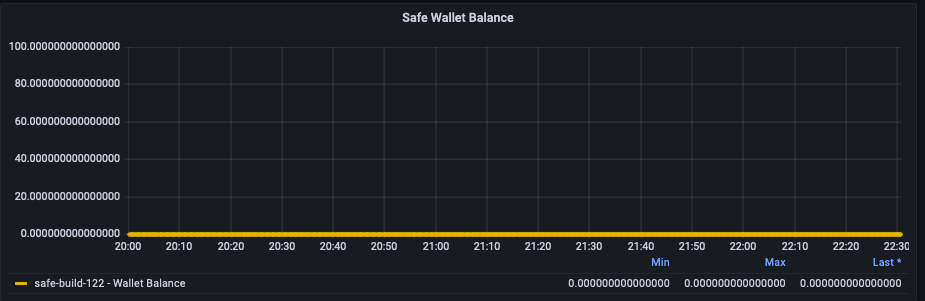
I can’t tell if the chunks that arrived are purely due to replication or new data being stored, as the SN Replication Triggered is showing 0 and the SN Wallet Balance also shows 0. I am guessing this is existing replicated data, and the SN Wallet Balance is accurate (being at 0.0), and likely the SN Replication Triggered is from the perspective of my node, and not chunk replication being received that was triggered from other nodes? Hmmm.
Is the memory rise due to the # of peers that increase post a burst of chunks stored in waves, or a combination of extra peers actively connected as well as a potential list of chunk addresses stored on disk (kept in-memory)?
Is something wrong? I had a node running but due to some spectacular idiocy trying to start some on another machine I logged onto the wrong one and killed it. Now I can’t get a single one running on anything in AWS or at home. I’m getting this in the logs:-
[2023-11-24T22:18:11.820741Z TRACE sn_node::replication] Not having enough peers to start replication: 1/20
I didn’t change anything in between.
There are a lot of Failed to dial messages near the start of the log.
I’m using the correct version and it downloaded the list of peers.
EDIT
I see this in the logs:-
[2023-11-24T21:53:11.820059Z INFO sn_node::node] Node has been subscribed to gossipsub topic 'TRANSFER_NOTIFICATION' to receive network royalties payments notifications.
So that sounds good but it’s the only indication I’m connected to anything.
I was searching for network_contacts and not network-contacts, whoops!
I should have tried more permutations but I have added the URL in my scripts as a side comment so I don’t forget the format of the filename in the URL.
On side note, I don’t think Github used to require an account to just search the repo before… sigh, :