Decent pump… (Price in AUD)

5 Likes
55% in 24H ![]()
Decentralized File Storage on CMC
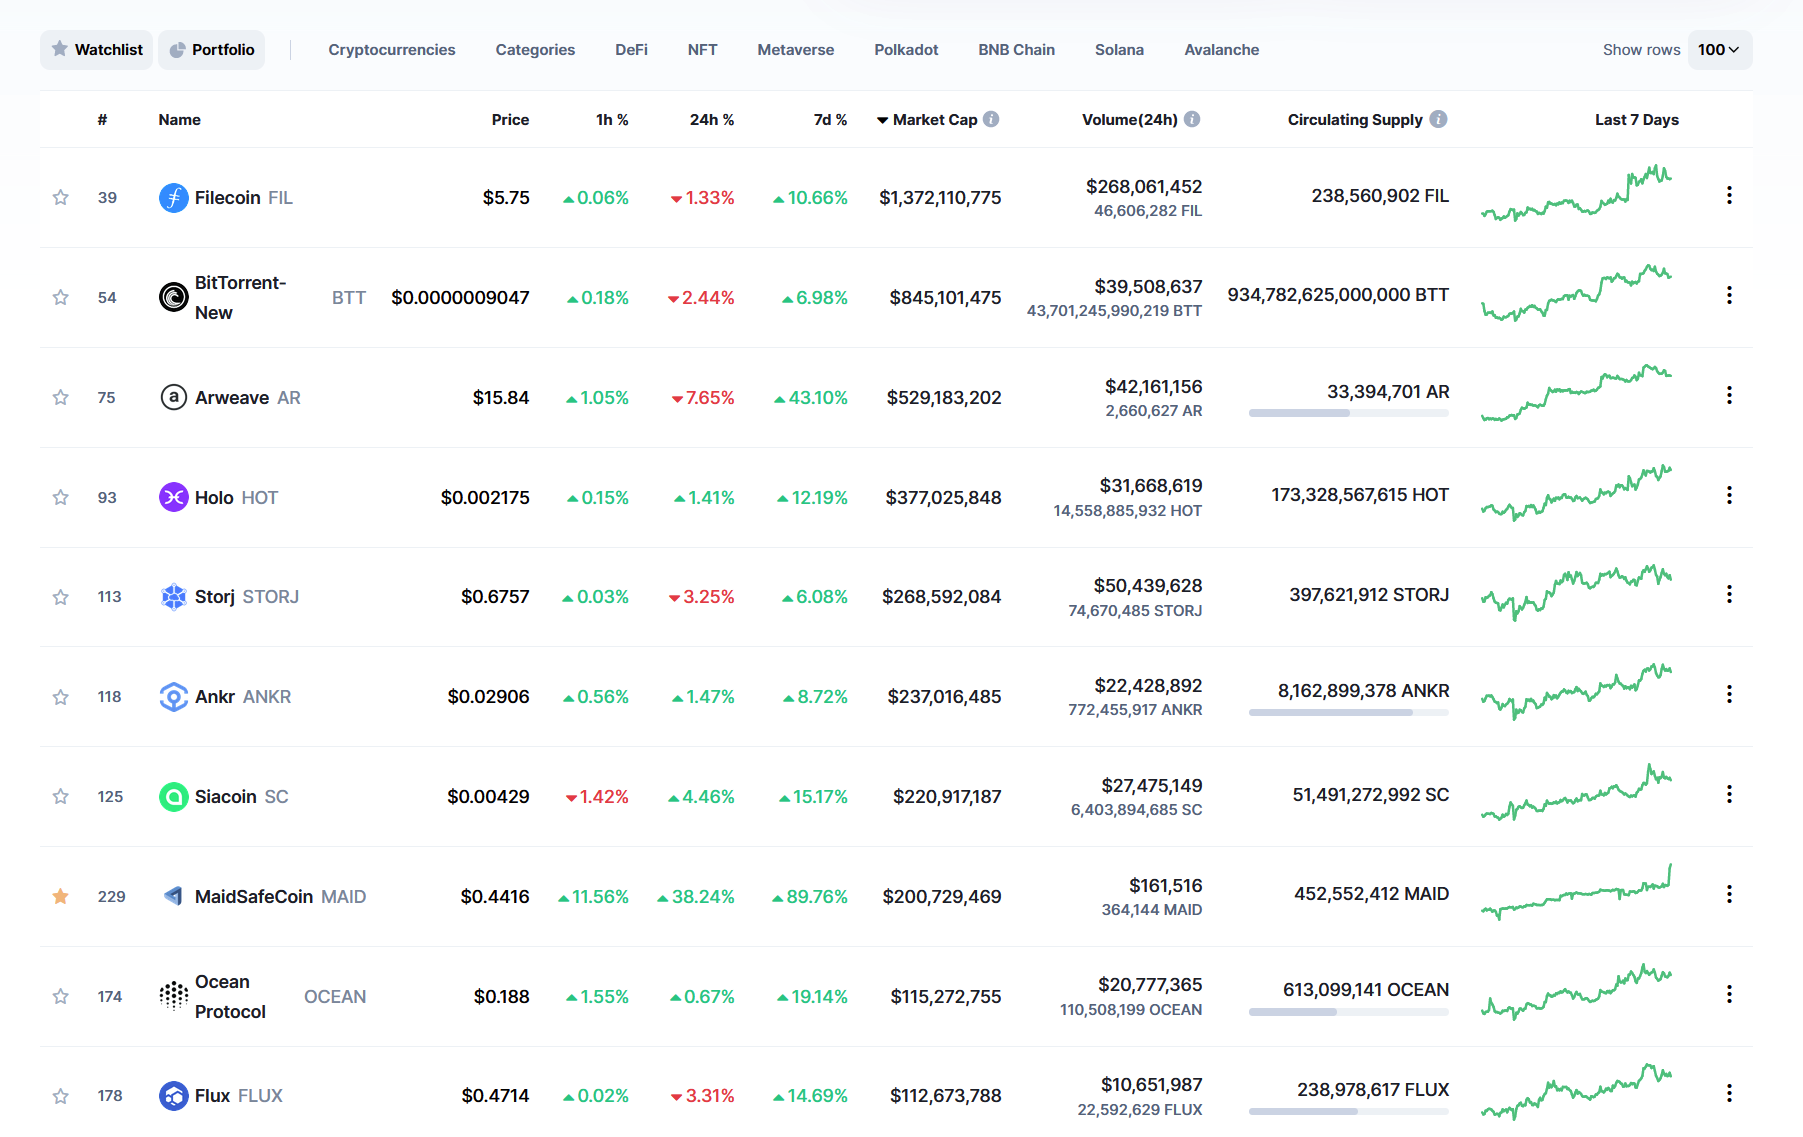
Top 3 is around 500-1400M USD, MAID should kick Filecoins ass once we are up and running.
10 Likes
i changed your code into a plotly graph (because i like plotly more than matplotlib), changed the y-axis to display the cumulated sum of orders (and i changed the calculation of the volume since the volume is returned in maid and not btc from bittrex
import requests

import pandas as pd
import plotly.graph_objects as go
import numpy as np

ODERBOOK_DEPTH = 100 # only allowed depths in the api are 1,25 and 500

url = 'https://api.bittrex.com/v3/markets/maid-btc/orderbook?depth=500'
req = requests.get(url)
data = req.json()


bids = []
asks = []

tempvol = 0.0
for bid in data['bid'][:ODERBOOK_DEPTH]:
    # 'rate','quantity
    tempvol +=float(bid['quantity'])*float(bid['rate'])
    bids.append([float(bid['rate']),tempvol])

tempvol = 0.0
for ask in data['ask'][:ODERBOOK_DEPTH]:
    # 'rate','quantity
    tempvol +=float(ask['quantity'])*float(ask['rate'])
    asks.append([float(ask['rate']),tempvol])

df_bids = pd.DataFrame(bids, columns=['rate','quantity_sum'])
df_asks = pd.DataFrame(asks, columns=['rate','quantity_sum'])

fig = go.Figure()
# Create and style traces
fig.add_trace(go.Scatter(x=df_bids.rate, y=df_bids.quantity_sum,
                         name='bids',
                         line=dict(color='green', width=4)))
fig.add_trace(go.Scatter(x=df_asks.rate, y=df_asks.quantity_sum,
                         name = 'asks',
                         line=dict(color='red', width=4)))
# Edit the layout
fig.update_layout(title='Orderbook Bittrex',
                   xaxis_title='rate in BTC',
                   yaxis_title='Volume in BTC')
fig.show()

5 Likes
and if we filter out the larger chunks of sell orders (any orders in the size of >=40% of all cumulated orders to that point, that are probably from a single actor trying to manipulate the market)
import requests

import pandas as pd
import plotly.graph_objects as go
import numpy as np

ODERBOOK_DEPTH = 100 # only allowed depths in the api are 1,25 and 500

url = 'https://api.bittrex.com/v3/markets/maid-btc/orderbook?depth=500'
req = requests.get(url)
data = req.json()


bids = []
asks = []

tempvol = 0.0
for bid in data['bid'][:ODERBOOK_DEPTH]:
    # 'rate','quantity
    if tempvol < 0.5 or float(bid['quantity'])*float(bid['rate']) < 0.4*tempvol:
        tempvol +=float(bid['quantity'])*float(bid['rate'])
        bids.append([float(bid['rate']),tempvol])

tempvol = 0.0
for ask in data['ask'][:ODERBOOK_DEPTH]:
    # 'rate','quantity
    if tempvol < 0.5 or float(ask['quantity'])*float(ask['rate']) < 0.4*tempvol:
        tempvol +=float(ask['quantity'])*float(ask['rate'])
        asks.append([float(ask['rate']),tempvol])

df_bids = pd.DataFrame(bids, columns=['rate','quantity_sum'])
df_asks = pd.DataFrame(asks, columns=['rate','quantity_sum'])

fig = go.Figure()
# Create and style traces
fig.add_trace(go.Scatter(x=df_bids.rate, y=df_bids.quantity_sum,
                         name='bids',
                         line=dict(color='green', width=4)))
fig.add_trace(go.Scatter(x=df_asks.rate, y=df_asks.quantity_sum,
                         name = 'asks',
                         line=dict(color='red', width=4)))
# Edit the layout
fig.update_layout(title='Orderbook Bittrex',
                   xaxis_title='rate in BTC',
                   yaxis_title='Volume in BTC')
fig.show()
we end up with a order profile that looks even steeper on the buy side than on the sell side
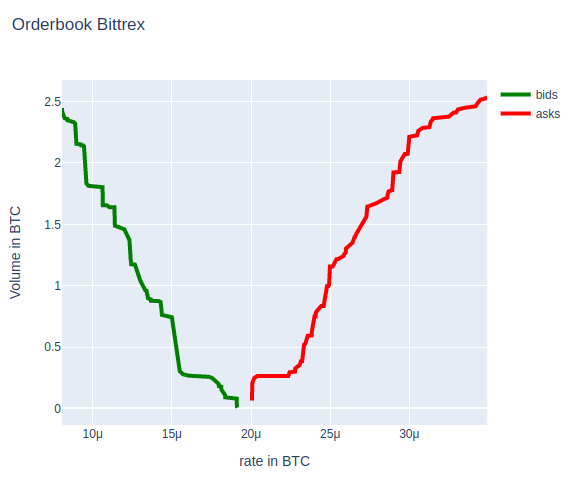
all ofc with pretty small volume ![]()
7 Likes
Looks good riddim, thanks for the additional effort. I found that Bittrex has a really bad orderbook visualizer, someone put some MAID for sale at 420 BTC for 1 MAID skewing the whole chart and making it unusable. Also putting if someone were to put big buy order at just 1 satoshi per MAID would mess things up. Would be cool if we can get websocket stream and update these Plotly or Matplotlib charts in real-time.
7 Likes
Whoa lot of price movement lately. At 36 cents now and saw it actually got to 48 cents last night. Is this just bot trades or is there substance behind the move?
4 Likes
You are such a tease ![]()
![]()
I assure you this is not my doing ![]()
the difference between ignoring and not ignoring the large sell chunks is very impressive
with the large sell orders

without

pressure seems to be building up ![]() let’s hope it’s not just a temporary euphoria and dumping afterwards
let’s hope it’s not just a temporary euphoria and dumping afterwards
7 Likes
Those chuncks will clear soon enough ![]()
4 Likes
hey can somebody explain me why 50% for 24 hours? Thanks
1 Like
I’m wondering the same thing!
I’ve ramped up my buying. You’re welcome.
But seriously - the tiny amount of eMAID I’ve bought on Uniswap barely moved the needle.
I am not a trader and don’t really know what I’m talking about but I’ve noticed by looking at the charts that in the past when BTC has gone up MAID has gone up and vice versa. In general.
However, the pattern seems to have changed in recent weeks. Now it seems that when BTC goes up MAID goes up proportionally more and when BTC goes down MAID doesn’t go down nearly as much. I think this is called ‘de-coupling’.
I think people are looking for other things to invest in that have more potential upside.
$0.20 was clearly too low considering the prospects for this project and the valuation of others such as Storj and Filecoin that are ‘one trick ponies’.
13 Likes
New record volume on eMAID/USDC - Uniswap

8 Likes
Is any of the exchanges clearly leading in these price movements?
They all seem to move up pretty much same. I think Bittrex had significant volume yesterday around 11 BTC and Uniswap less but still made new record also.
3 Likes
Before a stable network arrives, marketing campaigns launch, more exchanges (open to the US market) add the token to their offerings, sustained de-coupling happens, and liquidity begins to take hold, price is still susceptible to bots and trader pumps and dumps. If you can afford to, just HODL onto it and let it play out. I suspect the price is being pumped again to wrestle loose coin from weak hands and will dive again on a dump. Apologies for being a negative Ned.
4 Likes
If you actually believe it’s a pump and dump, wouldn’t it make more sense to sell into the pump and rebuy after the dump? Just ride the wave with the whale?
4 Likes
Ok call it a breathless, furious rise, and then a precipitous fall simply from natural market trading activity. And yes, if you are positioned to ride that wave with them, then do it. Seen it countless times before, so I’m just not convinced yet price is sustainable without the working network. And whenever someone asks “Why did it spike? or Why did it drop?” No one has an answer, and I know the whale isn’t jumping up, raising their hand and yelling “OOH, OOH, it’s me, I did that.”
Suddenly big downward just moments ago. But is it just a fluke!? Wait and see, on this wild ride.
1 Like