Same for me lots of nanos but no records
4 Likes
I am seeing same thing and so is @scottefc86
4 Likes
Probably one of MaidSafe:
- changed the log level of the message
- changed the logfile message itself
Because what vdash does is pick up values from one of the logfile messages.
I can’t check my logfile as my nodes aren’t working at all but I can check the source code to see if they’ve changed the format of the message.
Thanks for reporting this and those following up with “me too”. That’s very helpful. ![]()
I’ll get back to you.
8 Likes
Please can one of you grep "Cost is now" and post a handful of examples of that line. Looks like the format has changed there.
I ran first as normal, no change, then with SN_LOG=all. Here’s the log:
safenode.zip (28.6 KB)
2 Likes
The equation used to calculate the quote is:
// records_stored: records stored in the node,
//                 could be further updated to use `relevant_records`,
//                 i.e. those `stored records that in node's range`
// max_records: config parameter showing the storage capacity
// received_payment_times: counter of how many times the node got paid so far
// live_time: the durantion since when the node connected to the network

let ori_cost = 10 * records_stored;
let multiplier = max(1, 1.05.powf(records_stored - 0.6 * max_records));
let divider = max(1, records_stored / received_payment_times);
let rewarder = max(1, 1.1.powf(live_time.as_days());

let quote = ori_cost * multiplier / divider / rewarder;
5 Likes
could you send me the upload log, or the file you tried to upload?
thx.
1 Like
Thanks for that @joshuef, I think I saw a PR between tests about dialing back further, my traffic is down significantly on this network.
24h average is 3GB per node here, bbbbadnet I was seeing 16.5GB per node.
7 Likes
This raises a couple of questions/suggestions
- Relevant records is the only count that makes sense since the other stored records do not factor into fullness. They will be overwritten when new chunks come in so they are not a part of fullness.
- We have been repetitively told that age has no factor in the rewards. Jim told us in the stage that it is just whether the node is available to store and not how long it has been active.
- why is the number of times paid in the past a factor at all. That doesn’t make sense to me since each node is supposed to be no different to any other in respect to rewards (also applies to live time)
I am interested in why this has factors that can wildly affect the store cost and why it is not as clean as stated in the WP?
Also can this be included in the OP for each and every test/betanet
7 Likes
I am doing my first uploads but am getting this message:
Error:
   0: Not enough balance in wallet to pay for chunk. We have NanoTokens(52075965) but need NanoTokens(406245114) to pay for the chunk
Can I request some SNT somewhere or what is the best way to solve this?
8 Likes
You get these from the faucet as described in the OP. Well done for joining in!
7 Likes
Didn’t know you could request multiple times, thanks!
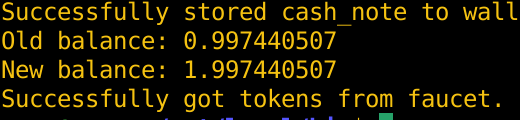
Very satisfying to interact with the network, it has been some time ![]()
10 Likes
You maybe jinxed it by choosing that name. I have made some observations about internet names during the years.
Bankman = Not the bank man you want to give your money to.
Heart = That man is a heartless soul
Foreverjoyful = Almost never joyful
Antifragile = Very fragile
![]()
4 Likes
happybeing ![]()
I often find names seem to hint at things. Though I see it more in real names than internet name. I think its a feature of our pattern matching brains that we see things that appear meaningful even in random data.
6 Likes
cost is now
safenode.log:[2024-03-29T05:42:48.565834Z INFO sn_networking::record_store] Cost is now 290 for quoting_metrics QuotingMetrics { records_stored: 406, max_records: 2048, received_payment_count: 28, live_time: 65694 }
safenode.log:[2024-03-29T05:44:34.477173Z INFO sn_networking::record_store] Cost is now 0 for quoting_metrics QuotingMetrics { records_stored: 407, max_records: 2048, received_payment_count: 28, live_time: 65799 }
safenode.log:[2024-03-29T05:45:32.004363Z INFO sn_networking::record_store] Cost is now 290 for quoting_metrics QuotingMetrics { records_stored: 407, max_records: 2048, received_payment_count: 28, live_time: 65857 }
safenode.log:[2024-03-29T05:46:23.250609Z INFO sn_networking::record_store] Cost is now 291 for quoting_metrics QuotingMetrics { records_stored: 408, max_records: 2048, received_payment_count: 28, live_time: 65908 }
safenode.log:[2024-03-29T05:48:36.715969Z INFO sn_networking::record_store] Cost is now 0 for quoting_metrics QuotingMetrics { records_stored: 409, max_records: 2048, received_payment_count: 28, live_time: 66042 }
safenode.log:[2024-03-29T05:50:13.907249Z INFO sn_networking::record_store] Cost is now 0 for quoting_metrics QuotingMetrics { records_stored: 410, max_records: 2048, received_payment_count: 28, live_time: 66139 }
safenode.log:[2024-03-29T05:51:41.042519Z INFO sn_networking::record_store] Cost is now 292 for quoting_metrics QuotingMetrics { records_stored: 410, max_records: 2048, received_payment_count: 28, live_time: 66226 }
safenode.log:[2024-03-29T05:52:41.060619Z INFO sn_networking::record_store] Cost is now 293 for quoting_metrics QuotingMetrics { records_stored: 411, max_records: 2048, received_payment_count: 28, live_time: 66286 }
safenode.log:[2024-03-29T05:57:02.263239Z INFO sn_networking::record_store] Cost is now 294 for quoting_metrics QuotingMetrics { records_stored: 412, max_records: 2048, received_payment_count: 29, live_time: 66547 }
safenode.log:[2024-03-29T06:00:02.695887Z INFO sn_networking::record_store] Cost is now 295 for quoting_metrics QuotingMetrics { records_stored: 413, max_records: 2048, received_payment_count: 29, live_time: 66728 }
safenode.log:[2024-03-29T06:00:52.605843Z INFO sn_networking::record_store] Cost is now 0 for quoting_metrics QuotingMetrics { records_stored: 414, max_records: 2048, received_payment_count: 30, live_time: 66778 }
safenode.log:[2024-03-29T06:04:57.908563Z INFO sn_networking::record_store] Cost is now 0 for quoting_metrics QuotingMetrics { records_stored: 415, max_records: 2048, received_payment_count: 30, live_time: 67023 }
safenode.log:[2024-03-29T06:08:36.268173Z INFO sn_networking::record_store] Cost is now 320 for quoting_metrics QuotingMetrics { records_stored: 416, max_records: 2048, received_payment_count: 30, live_time: 67241 }
safenode.log:[2024-03-29T06:11:25.773657Z INFO sn_networking::record_store] Cost is now 0 for quoting_metrics QuotingMetrics { records_stored: 418, max_records: 2048, received_payment_count: 30, live_time: 67411 }
safenode.log:[2024-03-29T06:11:27.848580Z INFO sn_networking::record_store] Cost is now 0 for quoting_metrics QuotingMetrics { records_stored: 418, max_records: 2048, received_payment_count: 30, live_time: 67413 }
safenode.log:[2024-03-29T06:12:09.726772Z INFO sn_networking::record_store] Cost is now 321 for quoting_metrics QuotingMetrics { records_stored: 418, max_records: 2048, received_payment_count: 30, live_time: 67455 }
safenode.log:[2024-03-29T06:16:45.240598Z INFO sn_networking::record_store] Cost is now 322 for quoting_metrics QuotingMetrics { records_stored: 419, max_records: 2048, received_payment_count: 30, live_time: 67730 }
safenode.log:[2024-03-29T06:16:45.504659Z INFO sn_networking::record_store] Cost is now 322 for quoting_metrics QuotingMetrics { records_stored: 419, max_records: 2048, received_payment_count: 30, live_time: 67730 }
safenode.log:[2024-03-29T06:18:03.043938Z INFO sn_networking::record_store] Cost is now 0 for quoting_metrics QuotingMetrics { records_stored: 422, max_records: 2048, received_payment_count: 30, live_time: 67808 }
safenode.log:[2024-03-29T06:19:56.766151Z INFO sn_networking::record_store] Cost is now 0 for quoting_metrics QuotingMetrics { records_stored: 422, max_records: 2048, received_payment_count: 30, live_time: 67922 }
safenode.log:[2024-03-29T06:20:07.190191Z INFO sn_networking::record_store] Cost is now 301 for quoting_metrics QuotingMetrics { records_stored: 422, max_records: 2048, received_payment_count: 30, live_time: 67932 }
safenode.log:[2024-03-29T06:26:02.944165Z INFO sn_networking::record_store] Cost is now 0 for quoting_metrics QuotingMetrics { records_stored: 423, max_records: 2048, received_payment_count: 30, live_time: 68288 }
safenode.log:[2024-03-29T06:27:52.432929Z INFO sn_networking::record_store] Cost is now 302 for quoting_metrics QuotingMetrics { records_stored: 423, max_records: 2048, received_payment_count: 30, live_time: 68397 }
safenode.log:[2024-03-29T09:05:07.361867Z INFO sn_networking::record_store] Cost is now 303 for quoting_metrics QuotingMetrics { records_stored: 425, max_records: 2048, received_payment_count: 30, live_time: 77832 }
safenode.log:[2024-03-29T09:15:48.186311Z INFO sn_networking::record_store] Cost is now 313 for quoting_metrics QuotingMetrics { records_stored: 439, max_records: 2048, received_payment_count: 30, live_time: 78473 }
safenode.log:[2024-03-29T09:17:07.566315Z INFO sn_networking::record_store] Cost is now 314 for quoting_metrics QuotingMetrics { records_stored: 440, max_records: 2048, received_payment_count: 30, live_time: 78553 }
records
safenode.log:[2024-03-29T06:19:56.766151Z INFO sn_networking::record_store] Cost is now 0 for quoting_metrics QuotingMetrics { records_stored: 422, max_records: 2048, received_payment_count: 30, live_time: 67922 }
safenode.log:[2024-03-29T06:20:07.190191Z INFO sn_networking::record_store] Cost is now 301 for quoting_metrics QuotingMetrics { records_stored: 422, max_records: 2048, received_payment_count: 30, live_time: 67932 }
safenode.log:[2024-03-29T06:20:07.190368Z DEBUG sn_node::quote] Created payment quote for NetworkAddress::ChunkAddress(7b401d - 9515050e353c837eeccb32a67042b5ef3708c62cca379e4384925e326b55263f): PaymentQuote { content: 7b401d(01111011).., cost: NanoTokens(301), timestamp: SystemTime { tv_sec: 1711693207, tv_nsec: 190230825 }, quoting_metrics: QuotingMetrics { records_stored: 422, max_records: 2048, received_payment_count: 30, live_time: 67932 } }
safenode.log:[2024-03-29T06:26:02.944165Z INFO sn_networking::record_store] Cost is now 0 for quoting_metrics QuotingMetrics { records_stored: 423, max_records: 2048, received_payment_count: 30, live_time: 68288 }
safenode.log:[2024-03-29T06:27:52.432929Z INFO sn_networking::record_store] Cost is now 302 for quoting_metrics QuotingMetrics { records_stored: 423, max_records: 2048, received_payment_count: 30, live_time: 68397 }
safenode.log:[2024-03-29T06:27:52.433107Z DEBUG sn_node::quote] Created payment quote for NetworkAddress::ChunkAddress(b9dc93 - 9536debba38e7db069f0472e5be914ad92733739e2c66757ec397ca3d346a895): PaymentQuote { content: b9dc93(10111001).., cost: NanoTokens(302), timestamp: SystemTime { tv_sec: 1711693672, tv_nsec: 432966928 }, quoting_metrics: QuotingMetrics { records_stored: 423, max_records: 2048, received_payment_count: 30, live_time: 68397 } }
safenode.log:[2024-03-29T09:05:07.361867Z INFO sn_networking::record_store] Cost is now 303 for quoting_metrics QuotingMetrics { records_stored: 425, max_records: 2048, received_payment_count: 30, live_time: 77832 }
safenode.log:[2024-03-29T09:05:07.362047Z DEBUG sn_node::quote] Created payment quote for NetworkAddress::ChunkAddress(5122bb - 952b781a0935ee5ea4b1919ad050e3f6a0d7c9ce5e7fde812d25ca8f506afbd0): PaymentQuote { content: 5122bb(01010001).., cost: NanoTokens(303), timestamp: SystemTime { tv_sec: 1711703107, tv_nsec: 361908755 }, quoting_metrics: QuotingMetrics { records_stored: 425, max_records: 2048, received_payment_count: 30, live_time: 77832 } }
safenode.log:[2024-03-29T09:15:48.186311Z INFO sn_networking::record_store] Cost is now 313 for quoting_metrics QuotingMetrics { records_stored: 439, max_records: 2048, received_payment_count: 30, live_time: 78473 }
safenode.log:[2024-03-29T09:15:48.186494Z DEBUG sn_node::quote] Created payment quote for NetworkAddress::ChunkAddress(2399fc - 950c47802e4e846b6779fc525dd035917462fc52a7027e95cd60d39eba78f146): PaymentQuote { content: 2399fc(00100011).., cost: NanoTokens(313), timestamp: SystemTime { tv_sec: 1711703748, tv_nsec: 186352149 }, quoting_metrics: QuotingMetrics { records_stored: 439, max_records: 2048, received_payment_count: 30, live_time: 78473 } }
safenode.log:[2024-03-29T09:17:07.566315Z INFO sn_networking::record_store] Cost is now 314 for quoting_metrics QuotingMetrics { records_stored: 440, max_records: 2048, received_payment_count: 30, live_time: 78553 }
safenode.log:[2024-03-29T09:17:07.566491Z DEBUG sn_node::quote] Created payment quote for NetworkAddress::ChunkAddress(9c1e22 - 950a02990a51b71e55ffad08947c631728b7024cd3b7e787b8e03d2c2827b60b): PaymentQuote { content: 9c1e22(10011100).., cost: NanoTokens(314), timestamp: SystemTime { tv_sec: 1711703827, tv_nsec: 566353691 }, quoting_metrics: QuotingMetrics { records_stored: 440, max_records: 2048, received_payment_count: 30, live_time: 78553 } }
safenode.log:[2024-03-29T09:27:04.280243Z INFO sn_networking::record_store] Cost is now 315 for quoting_metrics QuotingMetrics { records_stored: 442, max_records: 2048, received_payment_count: 30, live_time: 79149 }
safenode.log:[2024-03-29T09:27:04.280427Z DEBUG sn_node::quote] Created payment quote for NetworkAddress::ChunkAddress(e46bcd - 953a0733a012ad6df28a0abf481e36e9ebe4c29f8b227087ed3aa2fce941ce11): PaymentQuote { content: e46bcd(11100100).., cost: NanoTokens(315), timestamp: SystemTime { tv_sec: 1711704424, tv_nsec: 280287873 }, quoting_metrics: QuotingMetrics { records_stored: 442, max_records: 2048, received_payment_count: 30, live_time: 79149 } }
safenode.log:[2024-03-29T09:28:16.627689Z DEBUG sn_node::quote] Verifying payment quote for NetworkAddress::ChunkAddress(e46bcd - 953a0733a012ad6df28a0abf481e36e9ebe4c29f8b227087ed3aa2fce941ce11): PaymentQuote { content: e46bcd(11100100).., cost: NanoTokens(315), timestamp: SystemTime { tv_sec: 1711704424, tv_nsec: 280287873 }, quoting_metrics: QuotingMetrics { records_stored: 442, max_records: 2048, received_payment_count: 30, live_time: 79149 } }
safenode.log:[2024-03-29T09:33:57.740186Z INFO sn_networking::record_store] Cost is now 317 for quoting_metrics QuotingMetrics { records_stored: 444, max_records: 2048, received_payment_count: 31, live_time: 79563 }
safenode.log:[2024-03-29T09:33:57.740377Z DEBUG sn_node::quote] Created payment quote for NetworkAddress::ChunkAddress(8d67fe - 9516f6705b704ed13d9c02cefc3a3f76a98fa7615b7b750cd6a3dd0976b57a89): PaymentQuote { content: 8d67fe(10001101).., cost: NanoTokens(317), timestamp: SystemTime { tv_sec: 1711704837, tv_nsec: 740240361 }, quoting_metrics: QuotingMetrics { records_stored: 444, max_records: 2048, received_payment_count: 31, live_time: 79563 } }
safenode.log:[2024-03-29T09:34:36.977302Z DEBUG sn_node::quote] Verifying payment quote for NetworkAddress::ChunkAddress(8d67fe - 9516f6705b704ed13d9c02cefc3a3f76a98fa7615b7b750cd6a3dd0976b57a89): PaymentQuote { content: 8d67fe(10001101).., cost: NanoTokens(317), timestamp: SystemTime { tv_sec: 1711704837, tv_nsec: 740240361 }, quoting_metrics: QuotingMetrics { records_stored: 444, max_records: 2048, received_payment_count: 31, live_time: 79563 } }
safenode.log:[2024-03-29T09:34:52.540503Z DEBUG sn_node::quote] Verifying payment quote for NetworkAddress::ChunkAddress(8d67fe - 9516f6705b704ed13d9c02cefc3a3f76a98fa7615b7b750cd6a3dd0976b57a89): PaymentQuote { content: 8d67fe(10001101).., cost: NanoTokens(317), timestamp: SystemTime { tv_sec: 1711704837, tv_nsec: 740240361 }, quoting_metrics: QuotingMetrics { records_stored: 444, max_records: 2048, received_payment_count: 31, live_time: 79563 } }
safenode.log:[2024-03-29T09:34:57.061242Z DEBUG sn_node::quote] Verifying payment quote for NetworkAddress::ChunkAddress(8d67fe - 9516f6705b704ed13d9c02cefc3a3f76a98fa7615b7b750cd6a3dd0976b57a89): PaymentQuote { content: 8d67fe(10001101).., cost: NanoTokens(317), timestamp: SystemTime { tv_sec: 1711704837, tv_nsec: 740240361 }, quoting_metrics: QuotingMetrics { records_stored: 444, max_records: 2048, received_payment_count: 31, live_time: 79563 } }
safenode.log:[2024-03-29T09:39:22.547295Z INFO sn_networking::record_store] Cost is now 342 for quoting_metrics QuotingMetrics { records_stored: 445, max_records: 2048, received_payment_count: 34, live_time: 79888 }
safenode.log:[2024-03-29T09:39:22.547472Z DEBUG sn_node::quote] Created payment quote for NetworkAddress::ChunkAddress(ec6823 - 9519889d456ec928c346fa6cb2f7abb6db0c5d4c2f8b39bf6ba89b21e12d3b88): PaymentQuote { content: ec6823(11101100).., cost: NanoTokens(342), timestamp: SystemTime { tv_sec: 1711705162, tv_nsec: 547334289 }, quoting_metrics: QuotingMetrics { records_stored: 445, max_records: 2048, received_payment_count: 34, live_time: 79888 } }
How do I get the upload log please?
It’s the file that is in this directory.
4 Likes
So I still have nearly a whole token after doing a large upload. But just tried to do a small one and received the not enough tokens error … which makes no sense given the total data is very small compared to large files already uploaded. Has the price just soared to new heights?

So I’ve another token from the faucet now and will try again, but clearly the price has either gone to the moon since my last upload, or something is wrong.
Edit:
Yep, so second upload completed and payment was at moon levels:

Does this mean the network is full? I’m skeptical. Is the algo going too hard too fast? I believe so.
3 Likes
Could you send me the upload log pls?
or just the logs of quotes that received.
thx.
1 Like
For the 35 out of 50 nodes posted earlier, they too experienced this issue (at least the DialError(DialPeerConditionFalse(NotDialing))).
Below is the snippet off the log from 1 of them:
[2024-03-28T19:28:18.144895Z INFO sn_networking::event] Local node is listening on "/ip4/127.0.0.1/udp/12039/quic-v1/p2p/12D3KooWBXmZ8ypFuMc36gCkDTnrL2up6yMPhzDjrxef7sYXLjCn"
[2024-03-28T19:28:18.145065Z INFO sn_networking::event] Local node is listening on "/ip4/192.168.X.Y/udp/12039/quic-v1/p2p/12D3KooWBXmZ8ypFuMc36gCkDTnrL2up6yMPhzDjrxef7sYXLjCn"
[2024-03-28T19:28:18.145261Z DEBUG sn_node::node] BadNodesCheck interval set to 115s
[2024-03-28T19:28:18.145469Z INFO safenode::rpc_service] RPC Server listening on 192.168.X.Y:13039
[2024-03-28T19:28:18.147639Z ERROR sn_node::node] Failed to dial /ip4/138.68.146.254/udp/52597/quic-v1/p2p/12D3KooWDV4aSK3oxQNumbvKAvrAExKRhDSwEbti6y5JaW9MHeAv: DialError(DialPeerConditionFalse(NotDialing))

...
[2024-03-28T19:28:23.166077Z WARN sn_networking::event] OutgoingConnectionError to PeerId("12D3KooWDV4aSK3oxQNumbvKAvrAExKRhDSwEbti6y5JaW9MHeAv") on ConnectionId(1) - Transport([("/ip4/138.68.146.254/udp/52597/quic-v1/p2p/12D3KooWDV4aSK3oxQNumbvKAvrAExKRhDSwEbti6y5JaW9MHeAv", Other(Custom { kind: Other, error: Custom { kind: Other, error: HandshakeTimedOut } }))])
[2024-03-28T19:28:23.166216Z ERROR sn_networking::event] Dial errors len : 1
[2024-03-28T19:28:23.166237Z ERROR sn_networking::event] OutgoingTransport error : Other(Custom { kind: Other, error: Custom { kind: Other, error: HandshakeTimedOut } })
[2024-03-28T19:28:23.166262Z WARN sn_networking::event] Problematic error encountered: Custom { kind: Other, error: Custom { kind: Other, error: HandshakeTimedOut } }
[2024-03-28T19:28:23.166278Z WARN sn_networking::event] Cleaning out peer PeerId("12D3KooWDV4aSK3oxQNumbvKAvrAExKRhDSwEbti6y5JaW9MHeAv")
One thing I wanted to remind here is the handshake error is mostly happening on outgoing connections and its happening with 97.66%+ off public IP/ports that are not my own nodes… my own nodes’ public ip/port its complaining on is < 2.34%.
We manually confirm this to be our externally reachable address, though in theory it's possible we
are not actually reachable. (Peers can lie to us.) This is a good enough heuristic for now.
I will wait for Roland or others including yourself for more feedback here, but due to external address: new candidate messages coming in with ports that I did not define as input… are other peers potentially lying here (not just about my peer nodes) but other peers too?
As in some peers are seeing the right ports and others are not (or maybe more than 1 answer is coming back over time, and being added to the list, which then ultimately leads to timeouts as the port is potentially not even open (externally on that WAN IP)? Hmm.
I will keep reviewing my current home’s configuration for now.
@Southside - are you seeing handshake timeouts as well in this BasicEconomyTweaks testnet?
2 Likes