I had that thought too, but we’ve had this issue for many months so it might be that, or it could be something more fundamental.
We need to know what it is so we can understand how it may affect the network and whether it needs addressing. Unfortunately there has been very little response or explanation of this. Qi engaged not that long ago but I don’t think we shed much light.
@chriso not 100% this belongs here but twice now I have had a host running fine only to come to it later and all nodes are stopped.
I believe both occurrences were on ARM. (sorry did not pay too much attention the first time, thought it was a fluke) 99% sure it was ARM the previous time too. Both times on this new network.
Ran fine for several hours even had a log rotation.
I saw mention of this on discord too but they were blaming screen which I don’t get. It was running as a service without --auto-restart obvs.
I run on UPS so unlikely that it was power related and other ARM devices on the same power source continue without issue.
Edit: unlikely it is a ARM issue, just remembered that all my x64 hosts run with --auto-restart so I would not see this there.
It’s official! I earned my first 10 nanos!!! Now I know what my somewhat obvious issue was, I’m going to attempt getting my MacBook hooked on Amphetamine.
This could be part of MaudSafe’s testing. It could even be a deliberate attempt by them to fill up a certain area. Just to see what the effect is and if the network can cope.
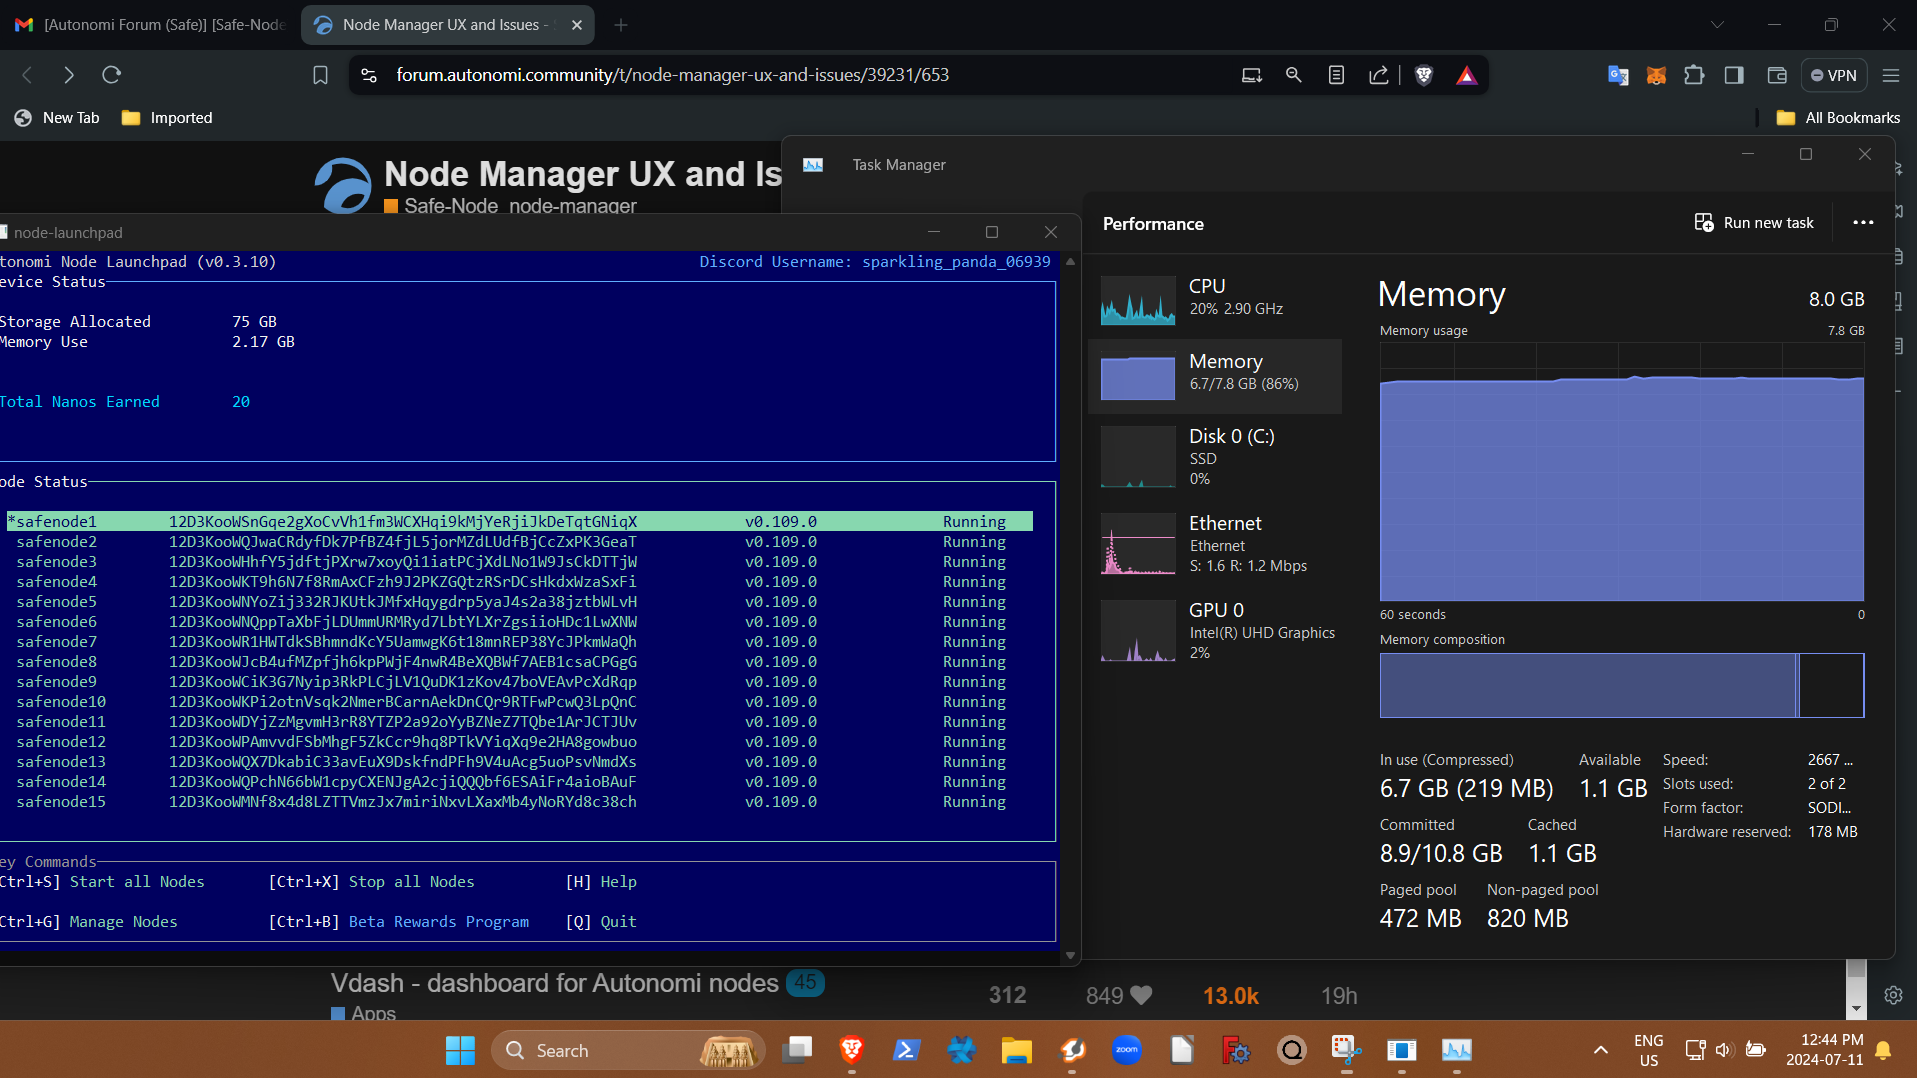
I notice my memory consumption per node has grown steadily to be doubled since Monday restart on the new code, this then pushed my whole MS WIN 11 system in to paging to disk via VRAM , the problem might be realated, it could be as a remedy you need to expand the VRAM allocation in combination with /swap , given the number of nodes you are running… where the peers per node in your close group are large meaning in aggregate the peer count is really high and there is a lot more spikey consumption of ram to handle the relays of chunks?
What does your network bandwidth consumption look like, spikey close to ‘practical’ BW I/O GE maximums given the cores/threads are all busy with the above?
As you can see I used to have 2+GB headspace to run Browser +gmail and an additional tab without paging to VRAM, now the system pages to VRAM on disk all the time with only 1GB of RAM headspace , and consumes more exlectricity in the process writing to the SSD and running the fan because the processor cores and threads are really busy , where nodes are handling on average 230 peers each.
[2024-07-11T16:17:23.732535Z WARN sn_networking::event::swarm] OutgoingConnectionError: On bootstrap peer PeerId(“12D3KooWFTMtaqu24ddDSXk9v5YxnuhJmTLFRunER1CG4wZ2XLUU”), while still in bootstrap mode, ignoring
15 safenodes with *230 peers each 2X for in/out = 6900 peer connections and that is just 15 safenodes…, on this little 8GB RAM WIN 11 system its consuming 2GB+ of RAM (25%) so 15 nodes in practices is the upper limit with the current beta 2 wave version , me thinks.
@Josh Yes I think this is the MS Windows Tax at work, the MS Defender gets really busy checking everything which also uses about 10% of the CPU clock on this 10thgen Intel Aspire notebook and some add’l ram …
Imo it might be soon time to crunch the Rust code into WASM runtime binaries, looking forward to wave 3 beta with the GUI, non? We also need more config advice re: number of nodes versus type of system and available type of core, thread, ram, bus (network) resources to help users optimally set up their safenodes in shared or dedicated mode… a simple gsheet calculator is likely in order…
@Josh also number of peers accepted by a node to be in the close group likely needs to be limited per a discovered (YAML/JSON config file) configuration referenced by safenodes before they boot? Configuring your fleet of safenodes is pretty wild west at the moment… everybody has their own angle…formula, which makes it really hard to debug the network as it grows…