Great stuff @mav. My tinkerings confirm your broad findings but without the meticulous attention to detail and hard numbers. Another oddity is safe files sync which takes a long time, especially if the --delete flag is used, and results in lots of DataExists errors.
6 Likes
Lately I’ve been testing sequence data, doing 50 append operations in a row. I’d expect each append to take about the same time, but they gradually get slower, so I’ve been looking into it to try and understand why.
Logs for the data used in this post are available for the nodes and client.
This is the overall process for all 50 uploads. The time from first append to last append was about 2 minutes.

The timeline shows nodes top-to-bottom, genesis node at the top, node 11 at the bottom. Time runs left-to-right. Each dot corresponds to a log message.
The first append takes 227ms, the 50th takes 1220ms. What’s causing the slowdown? Each append takes about 20ms longer than the last (with some significant variation but the trend of increasing time is definitely there).
The first append takes 227ms:
Adding in the client connect / append_start / append_end timings shows how the client timing compares to the node timing:

Gaps between dots mean there’s no logs at that time, there’s either a) things happening there which aren’t logged or b) waiting for a response for an async function. This is level 3/5 for logging (info), if we displayed the most detailed level 5/5 logging (trace) it would probably be a continuous stream of log messages with no gaps.
The last append takes 1220ms:

Looking at the last appends from the client perspective, it seems like the time between connect and start_append becomes quite significant:

It looks like maybe the red node could be a factor in the slowdown (seen even more clearly in the full timeline), but that’s just a hunch to explore later.
Now we have ‘the vibe of the thing’ we can start to look into some details.
The append operation is a combined process involving various reading and payment and writing operations, but in this post I’m zooming in to look only at the very end of the process, where nodes actually write the data to their chunk store (about the last 5% of the overall time taken to do an append, so it’s probably not significant for the overall append time, but within itself there are significant aspects to look at).
Nodes take about 11.47 ms to do the write for an append operation (ie the time to run SequenceStorage.write).
In the chart below we can see that each write takes about the same time, there’s no gradual increase in the time taken to write chunks like was seen with the overall append operation. There’s some variation, but no increase.

SequenceStorage.chunks.put(&sequence) (source) is taking 10.62ms of those 11.47ms, ie 93% of the work:

Within the chunks.put function, the breakdown is
4.08ms for do_delete (source)
3.62ms for used_space.increase (source)
3.81ms for file.sync_all (source).
These three calls account for 88% of the time taken to run chunks.put:

The real surprise to me is updating the stats for used space taking 3.62ms. That’s a very long time. But it’s a surprisingly complex operation, see fn increase.
It looks like within do_delete probably the call to used_space.decrease is taking most of the time (probably 3.62 of 4.08 ms ie 89%), similar to used_space.increase.
The file.sync_all taking 3.81ms warrants a little exploring too…
The docs for sync_all: This function will attempt to ensure that all in-memory data reaches the filesystem before returning.
Sounds like sync_all a feature worth keeping. I guess one day someone will compare the failure rate with/without and decide if it’s worth the extra work or not (removing sync is about 170x faster, see below).
Some further detailed discussion (and links) on sync_all in do we need to clarify the fsync close unixism.
use std::time::Instant;
use std::io::Write;

fn main() {
    let start = Instant::now();
    std::fs::File::create("data.txt").and_then(|mut file| {
        file.write_all("my value".as_bytes()).expect("write failed");
        file.sync_all()
    }).expect("create failed");
    println!("{:?}", start.elapsed().as_nanos());
}
// 4673048 nanoseconds
vs
use std::time::Instant;
use std::io::Write;

fn main() {
    let start = Instant::now();
    let mut file = std::fs::File::create("data.txt").expect("create failed");
    file.write_all("my value".as_bytes()).expect("write failed");
    println!("{:?}", start.elapsed().as_nanos());
}
// 27156 nanoseconds, 172x faster
Even though not syncing is so much faster, it seems like the added safety and data integrity is well worth it, especially at this stage of development, sync eliminates a potential thing that could go subtly wrong.
My hope is if we can find a more efficient way to manage the stats we should hopefully be able to bring this down from about ~12ms to ~4ms, which is a huge improvement (3x improvement). Still not much of dent in an overall 300ms append operation, but still a big saving for the particular section this post has been looking at.
20 Likes
Following on from the comparison of threshold_crypto vs blst which showed blst as between 2-12x faster than threshold_crypto.
I replaced threshold_crypto with blst. Hopefully uploads should be faster since time spent doing bls crypto operations should be at least halved.
I ran a test storing 20 files each 2 KB, recording the total time taken to run.
sn_node v0.30.0
sn_api v0.21.0
threshold_crypto:
| Test | Time (s) |
|---|---|
| 1 | 197.65 |
| 2 | 142.77 |
| 3 | 159.34 |
| 4 | 167.17 |
| 5 | 141.88 |
| Avg | 161.76 |
blst:
| Test | Time (s) |
|---|---|
| 1 | 213.15 |
| 2 | 195.68 |
| 3 | 209.36 |
| 4 | 214.01 |
| 5 | 212.72 |
| Avg | 208.99 |
blst was slower to do 20 uploads, even though the actual crypto operations are at least 2x faster.
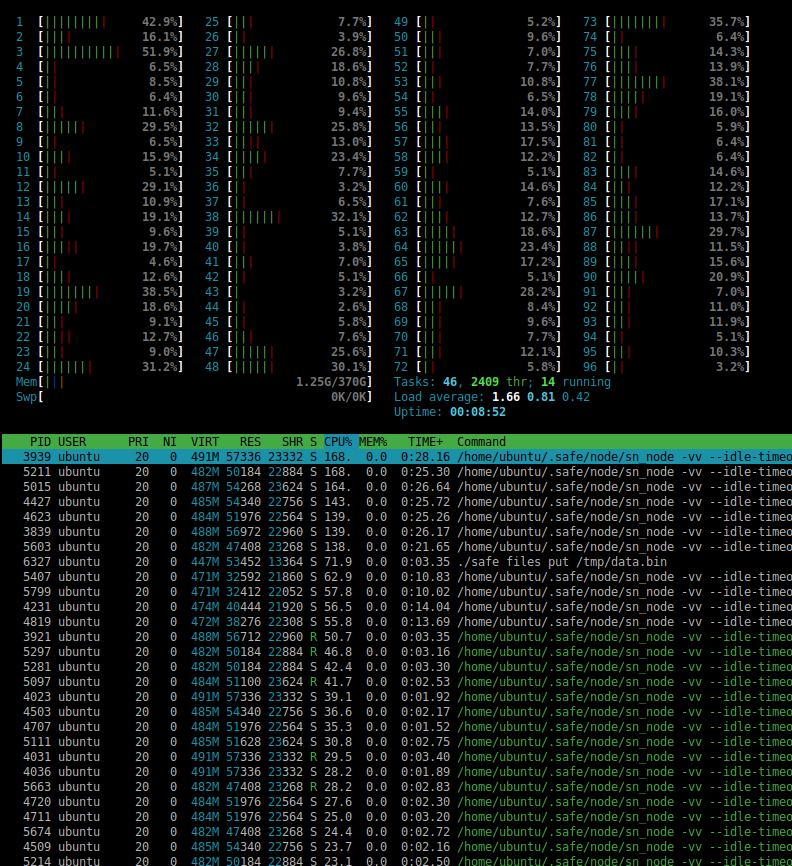
I don’t have numerical data unfortunately, but the cpu consumption was noticeably lower with blst (I have this cpu meter constantly running and there is very obviously much more green for threshold_crypto ![]() than blst
than blst ![]() ).
).
So, blst had a slower overall upload speed, but less cpu usage… very hard to intuitively guess what is causing it to be slower, but would love to hear if anyone has some ideas.
7 Likes
Looks like it is not efficiently using multiple CPU Cores and/or threads
3 Likes
Removing bls verification / signing altogether was also slower than threshold_crypto! I changed sign to give const response, verify to give always true
| Test | Time (s) |
|---|---|
| 1 | 183.44 |
| 2 | 200.64 |
| 3 | 152.27 |
| 4 | 211.03 |
| 5 | 200.49 |
| Avg | 189.58 |
My suspicion (totally just a hunch though) is there’s some messaging or queue or some-shared-action-between-nodes that only runs smoothly when there’s the bigger time variation of threshold_crypto. When that variation is removed there’s probably some greater degree of synchrony which is less efficient than spacing operations out slightly more. I’m going to look further into the no-verify-or-signing and see what else I can find.
Could be, but async is supposed to largely alleviate this. It’s still single-threaded but the key is there’s no synchronous blocking any more, so nodes should be very fast to do multiple things. When we account for each node being in their own process/thread then I don’t see why multithreading within a node would speed things up. But it’s definitely something to keep in mind.
I think for larger loads then perhaps multithreading will be more useful, but for a simple test like this I don’t reckon multithreading is creating any bottlenecks. But I’ll keep it in mind when I look in more detail. If one node is doing a bunch of stuff, then another node does a bunch, then another, all one after the other, then maybe the ‘bunch of stuff’ can be done in parallel which would be a good case for pursuing multithreading within nodes. Let’s see…
9 Likes
There was no big ‘aha’ moment looking at the timeline, but I’ll record what I saw (this is with no bls signatures or verification, so it’s showing just the data flow rather than the overhead for doing cryptographic operations).
Main observations:
- The client is doing 2.0-2.5 seconds work very early in the upload process, and the nodes are idle while that’s happening. 2s is a long time considered in isolation as raw cpu-time, and is also a long time relative to the overall upload time (between 5s-25s).
- The nodes get slower to process each upload. Average of 9.92% slower for each upload. First upload is ~4.8 seconds, last upload is ~24.4s.
Client taking 2s at the start of upload
This timeline shows upload #2 3 and 4. Upload 1 is slightly different so I’ve left it out to focus on the repeated upload pattern.

Nodes #1-11 are displayed from top to bottom. The cli begin/end events are at the bottom with the red lines. There’s a 3 second pause between each upload to try to visually separate them (Gap A and Gap C), so the red lines indicate where the client is active.
Gaps B and D are not expected.
The start of Gap B has a small flurry of activity from 3 nodes. This begins with nodes doing
TransferQuery::GetHistory
and ends with
QueryResponse::GetHistory(Success)
so it seems entirely history related.
Then there’s Gap B that lasts 2.347 seconds. Is the client doing 2+ seconds of work here? Seems hard to believe. It would be good to look into what’s happening on the client during these gaps. For now it’s quite informative to just see the nodes idle.
Then the first activity from the nodes after Gap B is
ClientMessageReceived ... cmd: SequenceWrite::NewSequence, payment: TransferAgreementProof
So it seems during Gap B the client is doing stuff for the TransferAgreementProof.
Another interesting point is the client considers the upload finished just before Gap C but there’s still about 150ms of node activity following it, which is all to do with writing sequence data. Nice to see async doing its thing here.
Gap D is the exact same story as Gap B.
Main takeaway: why is the client taking 2s between gethistory and transferagreementproof? Why does this happen on upload 3, 4, 5+ but not upload 2?
Nodes slow down
Looking at all 20 uploads it’s clear the nodes are getting slower on each upload.

The Gap B style pauses are quite consistent at around 2.0-2.5 seconds, but the overall time for each upload increases because the node processing time getting longer, not with any particular gaps just the whole process is gradually stretching out.
My feeling is this is to do with Sequence data (which is due for replacement by Register data type). In the past I’ve noticed I could get faster performance by minimizing the amount of modification to sequences:
- One Client and One Sequence With Many Appends - Very slow
- One Client and Many New Sequences - Less slow
- Many New Clients and Many New Sequences - Least slow
I’m very interested to test the replacement for Sequence Data when it arrives.
9 Likes
The client should be requesting transfer validations, and aggregating responses to that from elders here, before sending off the write cmd. It’s odd you’re not seeing those validation req logs there ![]() . What log level are you running here?
. What log level are you running here?
3 Likes
There was some problem with the last analysis, it has a lot of overlap which is misleading. I realised this mistake by setting the gap to be 30s between uploads (instead of 3s), and a different pattern becomes obvious.
This image covers a single upload and is about 11.5 seconds (there’s large 20s gaps before and after). The isolated parts are log lines for the TransferAgreementProof, isolated by filtering by MessageId (in this case a9ba02).

The log level for nodes is the default info and log level for the client is RUST_LOG=sn_api=trace,sn_client=trace,sn_transfers=trace (using #752).
The gap at the end is about 5 seconds.
The client (bottom brown dot) initiates the TransferAgreementProof, then it’s immediately processed by 3 nodes, then 5 seconds later is processed by the remaining 2 nodes.
In the previous charts this 5s lag was not obvious because there was only 3s between tests, so the lagging ones seemed to be part of the next test.
I wondered if this might be caused by
sn_authd/requests/subscribe.rs:const MAX_NUMBER_OF_NOTIF_SUBSCRIPTIONS: usize = 3;
But reading the code seemed probably not, and changing it to a larger value (I tried 10 and 1000) did not remove the lag.
I noticed this lag does not exist for the first upload, only upload 2 and onwards. Might be a clue in that.

So, I’m not much further ahead, but I feel I’m ‘less wrong’ than before. I have definitely learned it’s not too easy to isolate the log events other than by creating long pauses (eg in this particular case it’d be handy to attach an identifier for each upload such as safe files put /tmp/data.bin --logid my_unique_id that gets recorded with every log line). I’m still learning about how to read the logs, the nuance, the caveats etc. Hopefully as I progress with learning I can also improve the log visualizer to be more foolproof and useful.
18 Likes
Fascinating stuff. You’re a serious credit to the community mav.
7 Likes
Nodes have previously been -vv logging (info), so I turned on-vvvv (trace) logging to see if it shows anything more with what’s happening in the nodes, especially during that 5s gap. I’m especially wondering what is the event triggering the processing after 5s? Something seems to be idling and waiting, but what is it?
Here’s a bit of a braindump annotated image for my thoughts on that big gap.
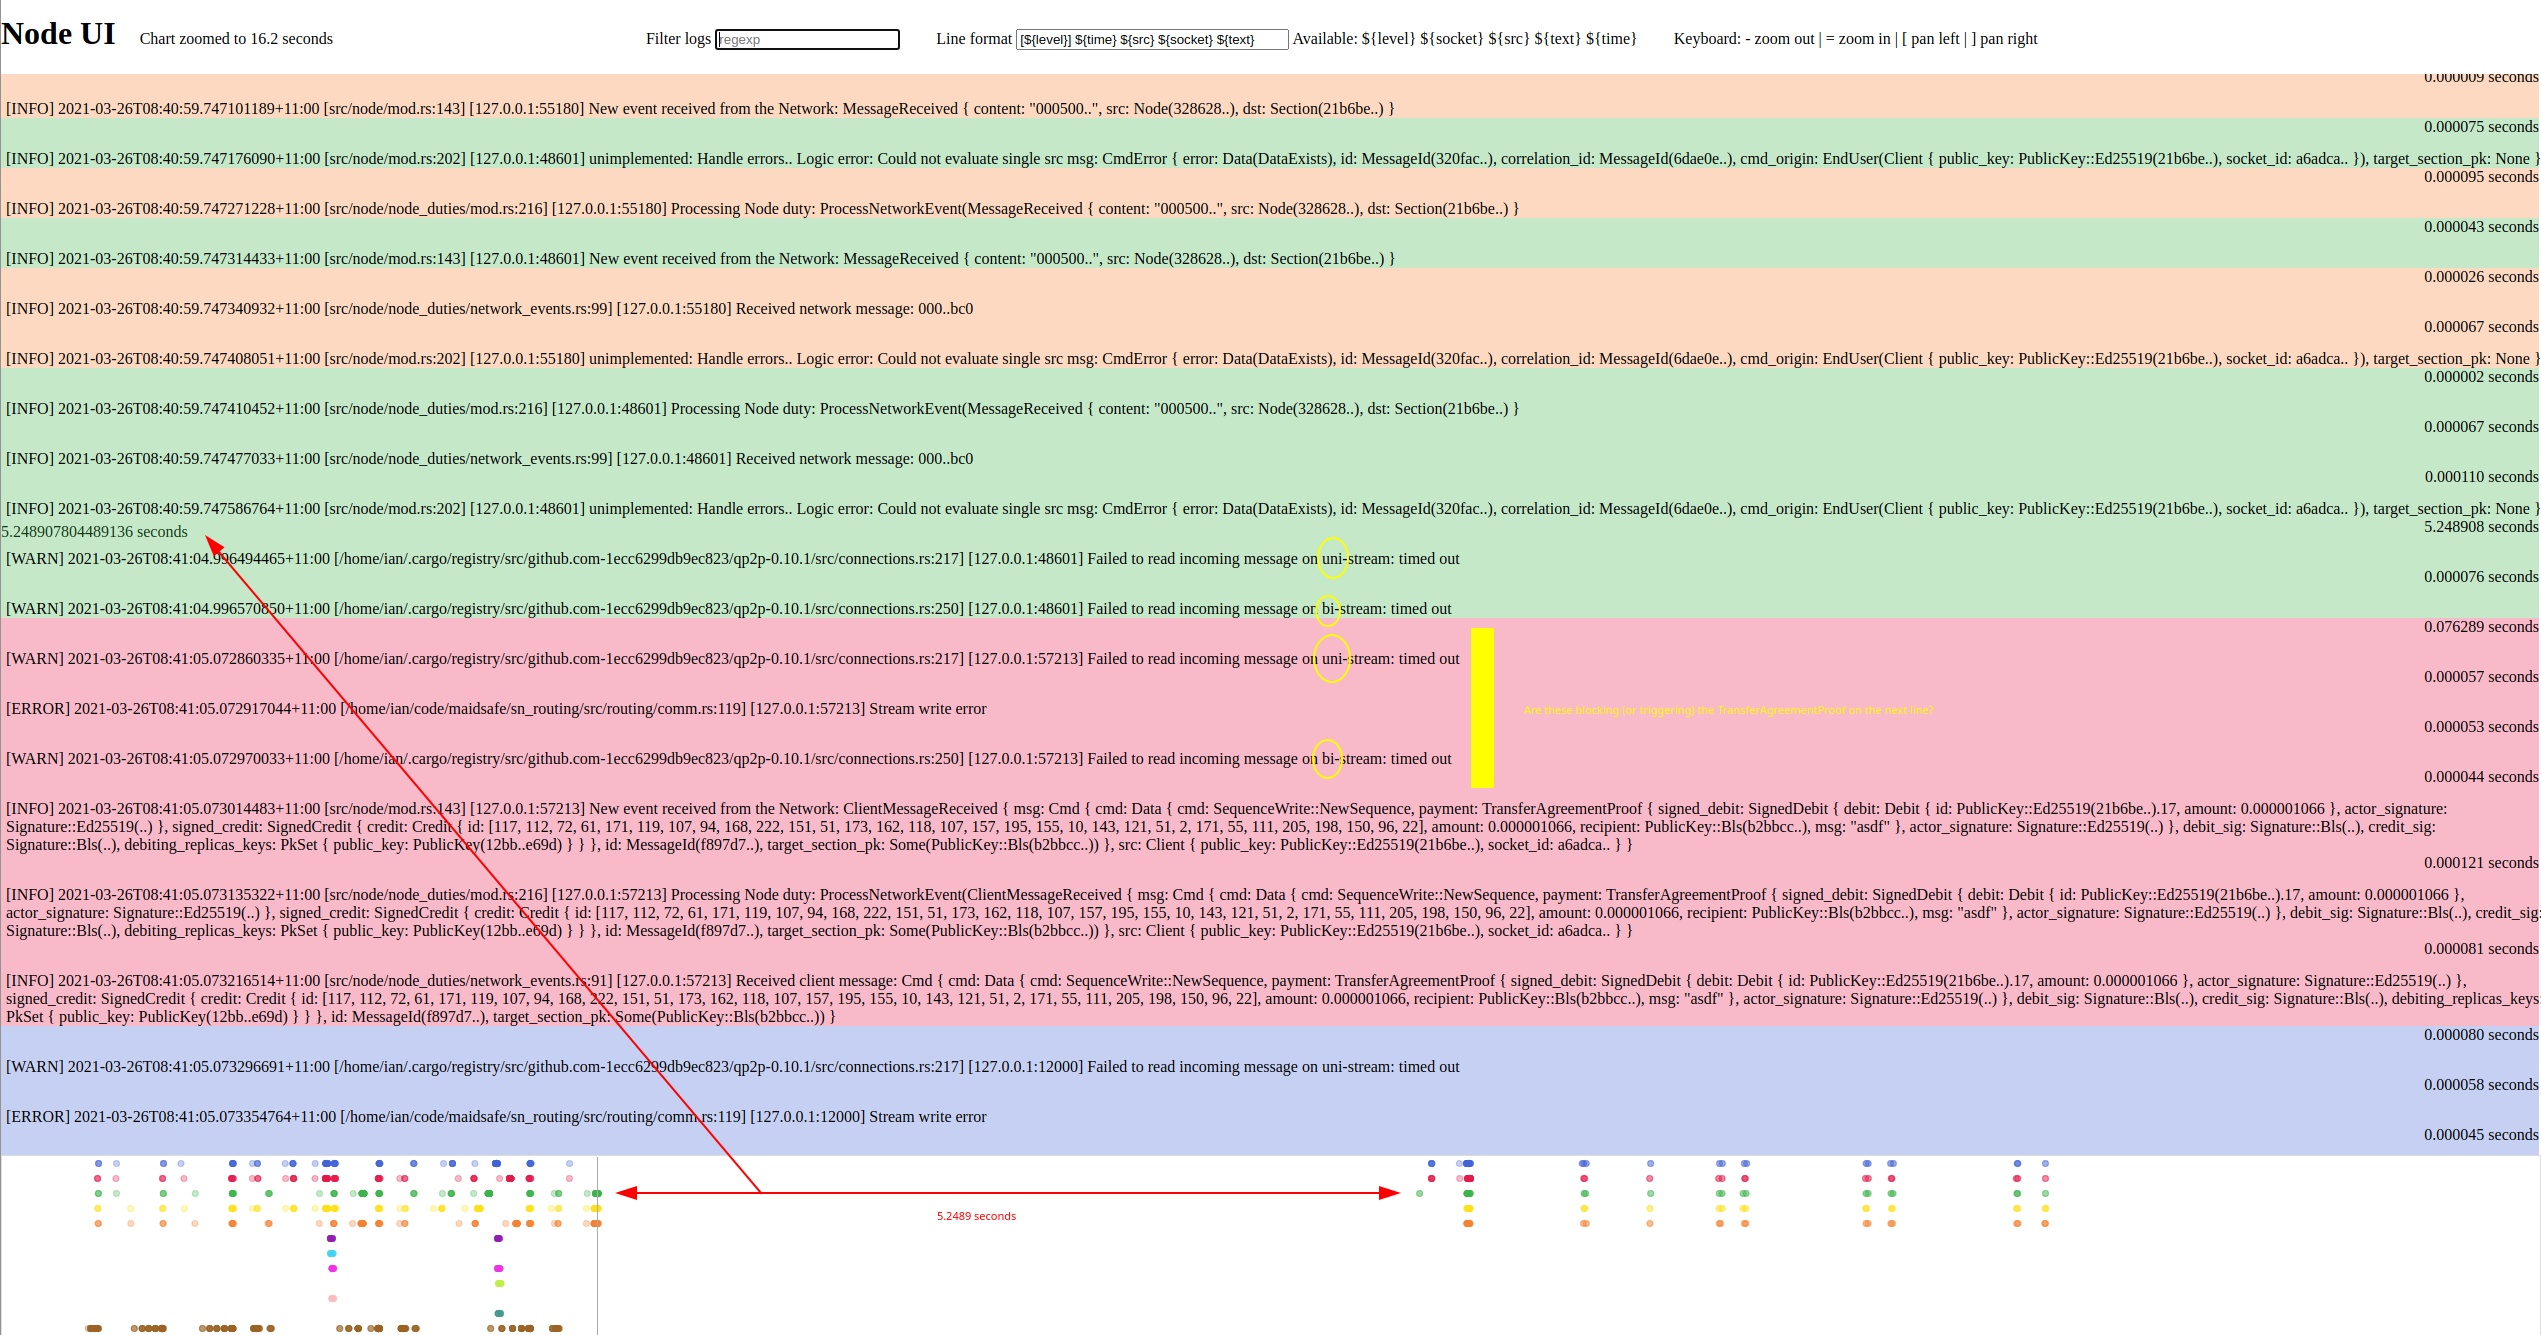
The gap might be due to some connections waiting for an event, then timing out, which allows the backlog containing TransferAgreementProof to be processed? Can’t exactly tell from these logs but it’s a theory to look into further.
What makes me scratch my head is I looked for const in sn_node, routing, messaging, transfers, qp2p, all the relevant crates (not quinn though), and did not see anything that seemed related to this kind of 5s worth of gap. There’s some 10s stuff, some 30s stuff, some 120s stuff… but nothing around the 5s mark.
Now that I type it out, I’m wondering if the 30s DEFAULT_IDLE_TIMEOUT and the 30s delay between tests might be giving me some misleading patterns. I’ll look into this too.
That gap, such a delicious mystery.
9 Likes
We’ve seen something along these lines before. So not inconceivable. Nodes are still not fully concurrent (though after last weeks refactor that becomes much simpler to impl, questions now are only around what’s the best way forward there). So you may well be correct here.
Loving the digging. Great stuff @mav!
7 Likes
I changed 30s delay between tests to 180s, but the chart looks the same except with wider spacing between tests. That means the error is not from something unexpected like one part of test #5 taking 30s to error and that error showing up midway through test #6. That’s not happening.
The next thing to look into is the connections and the event triggers. Why is there a timeout happening for TransferAgreementProof messages?
1 Like
Dec 2020 had a 10 MiB upload taking 53.7s (this post).
Today, using node v0.46.4 the results are much better:
Upload 10 MiB in 35.17s which is 35% faster
Exploring a bit further:
Upload 10 MiB in 25.62s with blst for sig verifications
Upload 10 MiB in 21.83s with no bls sig verifications (verify always returns true)
Great progress by the maidsafe team lately.
Test setup:
sn_node v0.46.4
sn_cli v0.27.0
sn_authd v0.8.1
One small change to sn_authd/Cargo.toml is required:
   [dependencies.sn_api]
-  version = "~0.26"
+  version = "~0.27"
13 Likes
I wanted to see if nodes get in each others way when doing 8-core-running-11-nodes, so I fired up some 16-core aws virtual machines which should leave some cores free (although now with multithreading in node that’s probably not true?!)
In summary, yes nodes do tend to get in the way of each other. Running 1 node per vCPU seems about the best ratio.
To clarify some terminology, a vCPU is not necessarily one cpu core. eg on my laptop I have 4 physical cores but with hyperthreading I get 2 vCPUs per physical core, so that’s a total of 8 vCPUs. This shows as 8 individual cpu graphs in task manager.
The basic test is:
Run baby fleming with node v0.49.8 and 11 nodes
Upload 10 MiB file using sn_cli v0.29.2
A1 ARM Procesors
Firstly, the A1 series of processors. From aws instance types: A1 instances are the first EC2 instances powered by AWS Graviton Processors that feature 64-bit Arm Neoverse cores and custom silicon designed by AWS.
Since maidsafe does not put out releases for arm architecture, I built the code on the first vm I started then copied those binaries to each of the other vms for the rest of the tests.
| Type | Time (s) | vCPUs | RAM (GB) |
|---|---|---|---|
| a1.medium | >600 | 1 | 2 |
| a1.large | >600 | 2 | 4 |
| a1.xlarge | 82.705 | 4 | 8 |
| a1.2xlarge | 42.559 | 8 | 16 |
| a1.4xlarge | 31.138 | 16 | 32 |
| a1.metal | 29.645 | 16 | 32 |
A tangential observation, I could not build with musl on arm. The ring crate was throwing an error, didn’t dig into it though, maybe one to look into later.
Command to try to build for aarch64 musl was
cargo build --release --target aarch64-unknown-linux-musl
M6G ARM Processors
From AWS: “deliver up to 40% better price/performance over current generation M5 instances and offer a balance of compute, memory, and networking resources for a broad set of workloads.”
| Type | Time (s) | vCPUs | RAM (GB) |
|---|---|---|---|
| m6g.medium | >600 | 1 | 4 |
| m6g.large | >600 | 2 | 8 |
| m6g.xlarge | 63.871 | 4 | 16 |
| m6g.2xlarge | 35.680 | 8 | 32 |
| m6g.4xlarge | 25.345 | 16 | 64 |
| m6g.8xlarge | 25.091 | 32 | 128 |
| m6g.12xlarge | 25.315 | 48 | 192 |
| m6g.16xlarge | 25.512 | 64 | 256 |
| m6g.metal | ? | 64 | 256 |
I couldn’t ssh into m6g.metal for some reason so there’s no result.
Once we get to 16+ cores the time stays pretty stable, shows that 11 nodes on 8 or less vCPUs is hitting some cpu bottlenecks.
M5 X86 Processors
“the latest generation of General Purpose Instances powered by Intel Xeon® Platinum 8175M processors. This family provides a balance of compute, memory, and network resources, and is a good choice for many applications.”
| Type | Time (s) | vCPUs | RAM (GB) |
|---|---|---|---|
| m5.large | 113.684 | 2 | 8 |
| m5.xlarge | 57.282 | 4 | 16 |
| m5.2xlarge | 30.285 | 8 | 32 |
| m5.4xlarge | 17.201 | 16 | 64 |
| m5.8xlarge | 14.951 | 32 | 128 |
| m5.12xlarge | 13.844 | 48 | 192 |
| m5.16xlarge | 13.952 | 64 | 256 |
| m5.24xlarge | 13.719 | 96 | 384 |
| m5.metal | 14.125 | 96 | 384 |
And yes, all 96 cores are used, shown here:
Improved bls lib
Following on from this post which says “3. Integrate a faster threshold_crypto” I thought let’s see what that’s like on the fastest platform the m5.24xlarge
m5.24xlarge gives 8.633s for the new lib vs 13.719s for the old one, quite a lot faster.
I also happened to test m5.metal which gave 12.422s for the new lib vs 14.125s for the old one.
17 Likes
For best operation, 1 physical core per node, with 2 physical cores reserved for OS are reasonable targets. Hyperthreaded VCPUs mean nothing when it comes to real compute for well optimized code. Hyperthreading helps when you have a lot of low compute processes, where it can hide/balance the inefficiencies/latencies. With the ratios above, each node could intermittently multithread (2 to 4 threads per process) without too much in efficiency/bottleneck imo. These are rules of thumb of course. A nice round of tests on production code like mav shows above will prove out the details.