and this is why your geting a custom version i knew you would spot something ![]()
thats it updated for sn_networking_peers_in_routing_table
run the script again and see if it all checks out
and this is why your geting a custom version i knew you would spot something ![]()
thats it updated for sn_networking_peers_in_routing_table
run the script again and see if it all checks out
Looks good.
The cpu figures show integers only? when they are down at 1% then its worth having one decimal place. But one node shows 109 for cpu. hmmmmmmmmmm have I got a rouge node or is cpu usage wrong in your script. I need to check it
Wow I do have a rouge node
cpu comes from the metrics output so its an int so possible rouge node.
you could curl the metrics for that node and take a look see what it says ?
cpu_usage=$(echo "$node_details" | grep sn_networking_process_cpu_usage_percentage | awk 'NR==3 {print $2}')
thats all there is to it in the scrip
ill DM you the install instructions ![]()
That rouge node was constantly uploading and downloading. My upload and download has dropped to 2/3rds of what it was. And I can actually run more nodes
happy days so one rouge node away makes the happy node indicator okay ![]()
I sent you the command to update to your version of the script.
if you update now and then watch the log file you will see if its working.
tail -f /tmp/influx-resources/influx-resources
next time it is due to print something will be at 20 past the hour. it runs every 15 min and prints data 5 min after that. it overwrites each time so if its empty it might not be an error
I just put in cpu usage into my status screen for my running nodes and it seems every so often a node will go overboard in CPU usage while uploading a lot of data, but this time it dropped back down and didn’t stay high. The upload bandwidth had jumped up high which is why I assumed it was uploading a lot
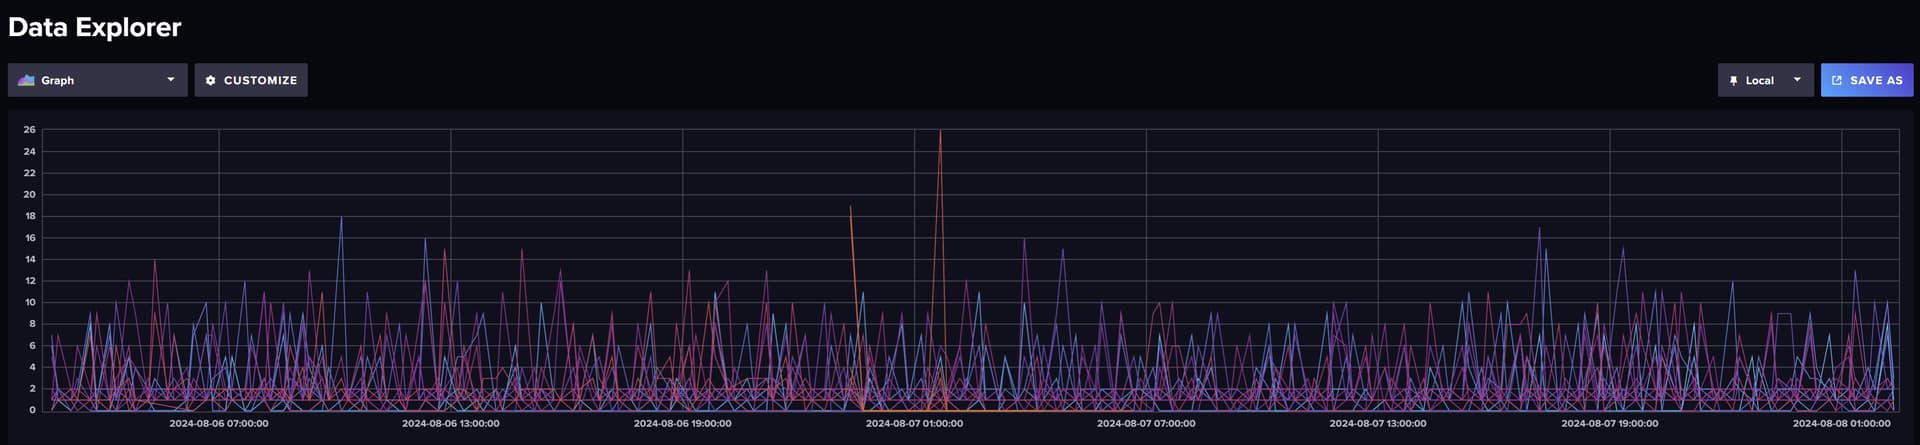
iv just checked in influx and here is what im seeing for node cpu usage so yea looks like every now and then one gets busy with things and drops back off
is that your NTracking working now ?
No I will look at installing it sometime. I am doing testing more now of stuff. I have my own node starter and stats viewer. Nothing as good like ntracker, and just a table.
if you get round to it just follow the git hub instructions and then run that comand i dm’d you to change out the script and you should be good to go ![]()
use less lipstick next time
Oh noes!!!
I get this (and more) when I tail /tmp/influx-resources/influx-resources
safe@wave1-bigbox:~$ tail -f /tmp/influx-resources/influx-resources
nodes,id=safenode001 PeerId="",status=TRUE,records=1551i,connected_peers=246i,rewards=18,store_cost=18i,cpu=1i,mem=156i,puts=754i,gets=3695i,version="0.110.0",networ_size=28672i 1723129200000000000
nodes,id=safenode002 PeerId="",status=TRUE,records=900i,connected_peers=244i,rewards=53,store_cost=80i,cpu=0i,mem=145i,puts=353i,gets=2491i,version="0.110.0",networ_size=20480i 1723129200000000000
nodes,id=safenode003 PeerId="",status=TRUE,records=670i,connected_peers=258i,rewards=0,store_cost=60i,cpu=0i,mem=173i,puts=212i,gets=1069i,version="0.110.0",networ_size=81920i 1723129200000000000
nodes,id=safenode004 PeerId="",status=TRUE,records=1162i,connected_peers=239i,rewards=0,store_cost=15i,cpu=0i,mem=163i,puts=434i,gets=2179i,version="0.110.0",networ_size=40960i 1723129200000000000
nodes,id=safenode005 PeerId="",status=TRUE,records=1055i,connected_peers=243i,rewards=10,store_cost=12i,cpu=0i,mem=147i,puts=387i,gets=2088i,version="0.110.0",networ_size=51200i 1723129200000000000
nodes,id=safenode006 PeerId="",status=TRUE,records=661i,connected_peers=260i,rewards=10,store_cost=10i,cpu=0i,mem=136i,puts=170i,gets=818i,version="0.110.0",networ_size=83968i 1723129200000000000
nodes,id=safenode007 PeerId="",status=TRUE,records=1142i,connected_peers=223i,rewards=0,store_cost=46i,cpu=0i,mem=159i,puts=758i,gets=10892i,version="0.110.0",networ_size=24576i 1723129200000000000
nodes,id=safenode008 PeerId="",status=TRUE,records=913i,connected_peers=238i,rewards=30,store_cost=58i,cpu=0i,mem=186i,puts=420i,gets=3902i,version="0.110.0",networ_size=31232i 1723129200000000000
nodes,id=safenode009 PeerId="",status=TRUE,records=1178i,connected_peers=233i,rewards=13,store_cost=13i,cpu=0i,mem=122i,puts=823i,gets=8433i,version="0.110.0",networ_size=30720i 1723129200000000000
nodes,id=safenode010 PeerId="",status=TRUE,records=1085i,connected_peers=237i,rewards=0,store_cost=10i,cpu=0i,mem=126i,puts=889i,gets=5906i,version="0.110.0",networ_size=43008i 1723129200000000000
nodes,id=safenode011 PeerId="",status=TRUE,records=618i,connected_peers=252i,rewards=10,store_cost=10i,cpu=0i,mem=146i,puts=376i,gets=1889i,version="0.110.0",networ_size=53248i 1723129200000000000
nodes,id=safenode012 PeerId="",status=TRUE,records=1078i,connected_peers=230i,rewards=10,store_cost=31i,cpu=0i,mem=159i,puts=824i,gets=7200i,version="0.110.0",networ_size=22528i 1723129200000000000
nodes,id=safenode013 PeerId="",status=TRUE,records=2167i,connected_peers=207i,rewards=10,store_cost=11i,cpu=0i,mem=132i,puts=1670i,gets=12524i,version="0.110.0",networ_size=14848i 1723129200000000000
nodes,id=safenode014 PeerId="",status=TRUE,records=1975i,connected_peers=212i,rewards=40,store_cost=90i,cpu=0i,mem=110i,puts=1598i,gets=14635i,version="0.110.0",networ_size=13312i 1723129200000000000
nodes,id=safenode015 PeerId="",status=TRUE,records=1497i,connected_peers=216i,rewards=16,store_cost=16i,cpu=0i,mem=117i,puts=1254i,gets=9626i,version="0.110.0",networ_size=17408i 1723129200000000000
nodes,id=safenode016 PeerId="",status=TRUE,records=1520i,connected_peers=238i,rewards=26,store_cost=28i,cpu=0i,mem=108i,puts=843i,gets=7045i,version="0.110.0",networ_size=43008i 1723129200000000000
no happy…
I’m guessing you are not running those nodes as services ?
Acksherly, I am running them as services…
Ive waited for te 15 and 20 past the hour and its not updating so I’ll rip out the bucket , refresh Grafana and influxdb and try again.
Did you see my PR? No sooner submitted it than I saw a few more (trivial) things I could correct. Ill do another later.
edit
Hmm now tail -f seems to be missing 398 records… I will poke further at that
@wave1-bigbox:~$ tail -f /tmp/influx-resources/influx-resources
nodes,id=safenode399 PeerId="NotReachableStoppedNode",status=FALSE,records=0i,connected_peers=0i,rewards=0,store_cost=0i,cpu=0i,mem=0i,puts=0i,gets=0i,version="0.109.0",networ_size=0i 1723134600000000000
nodes,id=safenode400 PeerId="NotReachableStoppedNode",status=FALSE,records=0i,connected_peers=0i,rewards=0,store_cost=0i,cpu=0i,mem=0i,puts=0i,gets=0i,version="0.109.0",networ_size=0i 1723134600000000000
nodes,id=safenode401 PeerId="NotReachableStoppedNode",status=FALSE,records=0i,connected_peers=0i,rewards=0,store_cost=0i,cpu=0i,mem=0i,puts=0i,gets=0i,version="",networ_size=0i 1723134600000000000
nodes,id=safenode402 PeerId="NotReachableStoppedNode",status=FALSE,records=0i,connected_peers=0i,rewards=0,store_cost=0i,cpu=0i,mem=0i,puts=0i,gets=0i,version="",networ_size=0i 1723134600000000000
nodes_totals rewards=.0000062060,nodes_running=346i,nodes_killed=56i 1723134600000000000
nodes_totals total_disk=101597i 1723134600000000000
nodes_coingecko,curency=gbp exchange_rate=0.339167,marketcap=11266694.227246262,earnings=.0000021048  1723134600000000000
nodes_coingecko,curency=usd exchange_rate=0.432055,marketcap=14350392.716530662,earnings=.0000026813  1723134600000000000
nodes_network size=36011i 1723134600000000000
nodes latency=5.163 1723134600000000000
My bad it’s systemctl not being fast enough for all those status requests on a heavily loaded system.
I’ll just remove the peer id as it’s just causing problems at the moment.
I’ll let you know when iv sorted and to update
The system is over loaded if the nodes do not respond on there metrics port they are listed as stoppednodes
Sorry I should have made it clearer
I ADDED 400 nodes a while back
I have STARTED ~300 of them now with sysctl
They seem to be doing OK
### Autonomi Bot Official*:*

You have earned **11604** nanos from your nodes this week. Based on your Node Nanos you are currently: **12** / 175 on this week’s leaderboard!
Nodes 398 up were never started - or even upgraded.
ok I was about to start messing with the script so everything’s fine it was a self inflicted problem ?
keep an eye on your cpu every 15 minutes and let me know if there are any large spikes every 15 min i could add some sleeps into the loop to try and smoth them out if they exist.
I am saving peerid and version to an array on start-up so im blind with how that part of the script is performing on the safe node manager part of it.
@aatonnomicc
Seems we’ve had a change in metrics operations.
For instance wallet balance in metrics shows zero for my nodes if owner is set. And forwarded balance is the only one that shows anything. /rank is so slow in updating I have no gauge to know if its accurate or doubling up or not.
Some of the new metrics, especially the ones around quoting (used to calc quote) only get updated when a quote is requested. IE they only show the value at the time of the last quote. Look at the comments to know which ones they are since they will mention that those values are used for quotes.
Some metrics have had a name change wallet and forwarded have “_Nano” added.
@Shu Wondering why there are now upper case characters for the additional words added to the names. Also why “…_percentage_Percentage” as that seems redundant when previously there wasn’t a doubling up of the words.
Here are some of the metrics
sn_node_current_reward_wallet_balance_Nano 0
sn_node_total_forwarded_rewards_Nano 30
sn_node_uptime_seconds 217010
sn_networking_records_stored 1378
sn_networking_connected_peers 99
sn_networking_estimated_network_size 20480
sn_networking_open_connections 101
sn_networking_peers_in_routing_table 229
sn_networking_shunned_count_total 1
sn_networking_bad_peers_count_total 37
sn_networking_process_memory_used_mb_MegaByte 685
sn_networking_process_cpu_usage_percentage_Percentage 0
sn_networking_store_cost 10
sn_networking_relevant_records 1039
sn_networking_max_records 4096
sn_networking_received_payment_count 3
sn_networking_live_time 178172
For instance wallet balance in metrics shows zero for my nodes if owner is set.
Yes, because the rewards have been forwarded hence subtracted on this metric.
And forwarded balance is the only one that shows anything.
Yes, if the forwarding mechanism is working properly.
especially the ones around quoting (used to calc quote) only get updated when a quote is requested. IE they only show the value at the time of the last quote.
Yes, that’s right. If store_cost in future requests shows 0, it means the node already has the record.
Also why “…_percentage_Percentage” as that seems redundant when previously there wasn’t a doubling up of the words.
I agree with you on the labeling issue here. That was all unintentional.
I think this PR is meant to revert it. Its currently not on the stable production release.
Prior to the last update it was showing the earnings correctly and forwarded had the multi accounting bug. Thats why I noticed it because my monitoring script used the wallet balance rather than forwarded.
Its good that now it is the correct operation.
Thank you for confirming that, it has been mentioned before and is then still the case.
My point was more to @aatonnomicc that some metric values are only updated when a quote is requested and the node does the calculations and populates the sn vars
@Shu this raises a question, Is it possible to grab the underlying values that are constantly updated? Like the records that the node is responsible for (sn_networking_relevant_records) is zero without a quote being done at all. At the moment it is zero until a quote is done and does not seem to be updated until another quote happens.
And another question if I may and prob the last question for the time being. What is the difference between up time and live time. They are different by a large margin